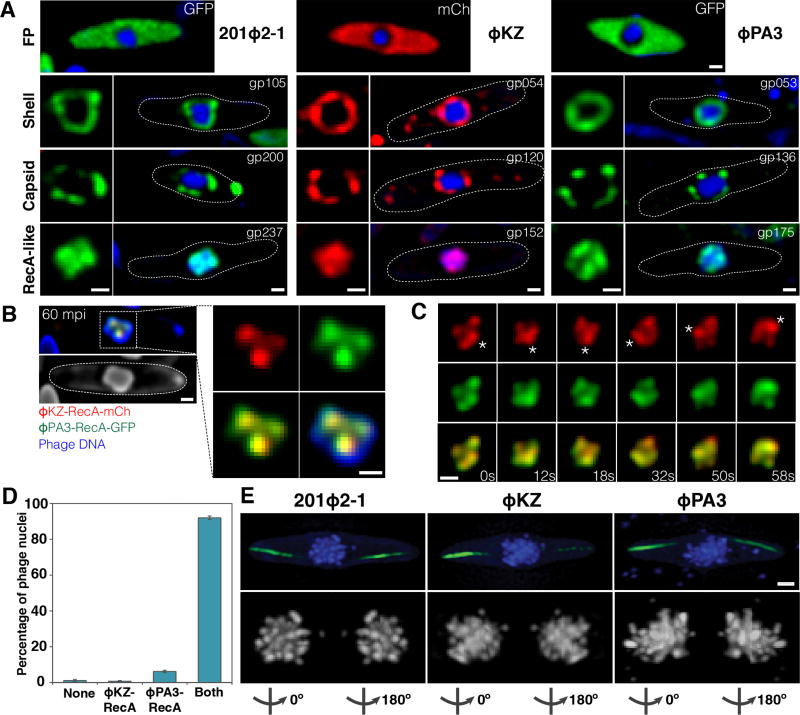
Figure 1. 201Φ2-1, ΦKZ, and ΦPA3 assemble a nucleus-like structure that compartmentalizes proteins and DNA during viral replication.
Cells were grown on an agarose pad and the fusion proteins were induced with arabinose at the indicated concentrations. P. chlororaphis was infected with 201Φ2-1 and P. aeruginosa with phages ΦKZ or ΦPA3, and imaged at approximately 60 mpi (A,B,D) or 90 mpi (C,E). Phage DNA is stained with DAPI (blue). These proteins do not assemble in uninfected cells. All scale bars equal 0.5 micron. See also Figure S1.
A) Top row: Fluorescence micrographs of infected P. chlororaphis and infected P. aeruginosa cells expressing fluorescent proteins (GFP, green) or (mCherry, red) alone from the arabinose promoter. Second row: Fluorescence micrographs of infected P. chlororaphis and infected P. aeruginosa cells expressing fluorescent protein fusions to the conserved nuclear shell proteins gp105 of 201Φ2-1 (0.2% arabinose), gp054 of ΦKZ (0.025% arabinose), and gp053 of ΦPA3 (0.025% arabinose). In rows two through four, the square panel on the left is an enlarged image of fluorescent proteins shown within cells whose border is indicated by a dotted line. Third row: Fluorescence micrographs of infected P. chlororaphis and infected P. aeruginosa cells expressing fluorescent protein fusions to the major capsid proteins gp200 of 201Φ2-1 (0.2% arabinose), gp120 of ΦKZ (0.05% arabinose), and gp136 of ΦPA3 (0.05% arabinose). Fourth row: Fluorescence micrographs of infected P. chlororaphis and infected P. aeruginosa cells expressing fluorescent protein fusions to the RecA-like protein gp237 of 201Φ2-1 (0.2% arabinose), gp152 of ΦKZ (0.025% arabinose), and gp175 of ΦPA3 (0.025% arabinose).
B) Co-localization of RecA-related proteins ΦKZ-gp152-mCherry (red) and ΦPA3-gp175-GFP (green) in the 201Φ2-1 nucleus (stained blue by DAPI or gray) during phage 201Φ2-1 infection. P. chlororaphis expressing ΦKZ-gp152-mCherry and ΦPA3-gp175-GFP (0.1% arabinose) was infected with 201Φ2-1 and visualized at 60 mpi. The region indicated by a dashed box is magnified and shown on the right. Scale bar equals 0.5 micron.
C) Time-lapse imaging (seconds) of ΦKZ-gp152-mCherry (red) and ΦPA3-gp175-GFP (green) in the 201Φ2-1 nucleus showing both RecA-related proteins form foci which move together as the 201Φ2-1 nucleus rotates over the course of 58 seconds. The position of the focus (asterisk) was tracked for the duration of the time-lapse. Scale bar equals 0.5 micron. See also Movie S1.
D) Graph showing percentage of 201Φ2-1 nuclei of infected P. chlororaphis cells containing no proteins inside (none), either ΦKZ-gp152 or ΦPA3-gp175 inside, or both RecA-related proteins inside. Data were collected from the infected cells at 60 mpi from at least 3 different fields and are represented as mean ± standard error of the mean (n = 263).
E) SIM images of infected P. chlororaphis and infected P. aeruginosa at 90 mpi showing encapsidated phage clusters localized at midcell as determined by DAPI staining (blue or gray). GFP-PhuZ filaments (green) extend from both cell poles toward the viral nucleus at midcell. 3D-SIM and rotation of the phage nucleus around Y-axis show that the nucleus is surrounded with encapsidated phages (degree of rotation is indicated below each subset). Scale bar equals 0.5 micron.

