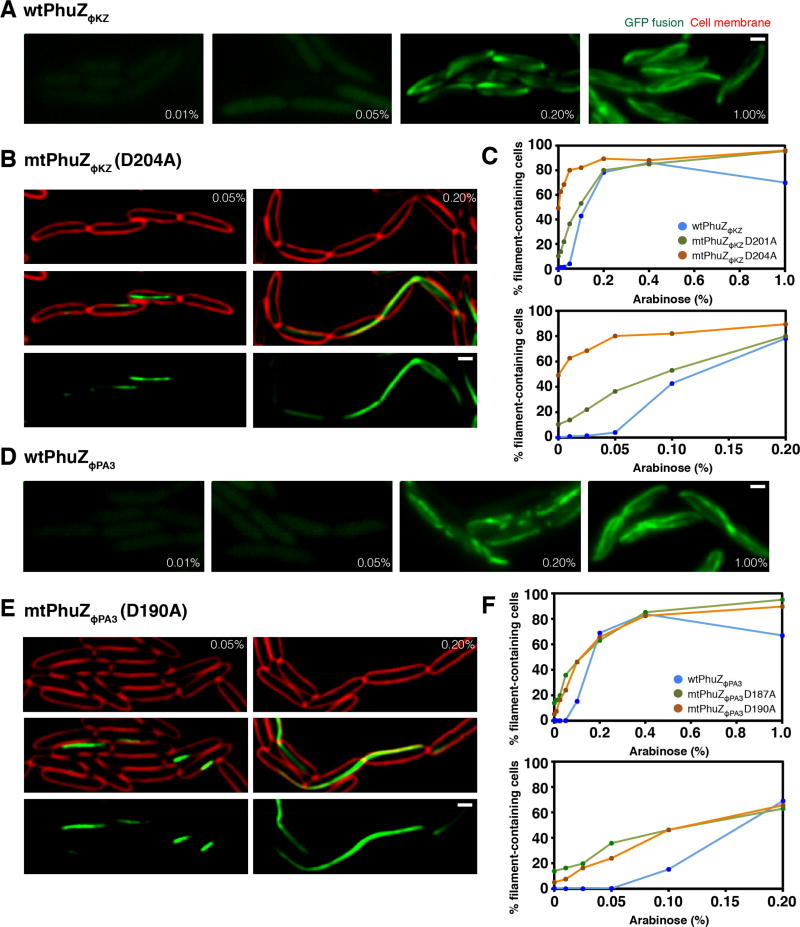
Figure 2. PhuZ requires a critical threshold concentration to polymerize in P. aeruginosa.
Cells were grown on an agarose pad and the fusion proteins were induced at the indicated arabinose concentrations. Cell membranes were stained with FM4-64 (red). All scale bars equal 1 micron. See also Figures S2 and S3.
A) Fluorescence images of cells expressing wild-type GFP-PhuZΦKZ at the indicated arabinose concentrations.
B) P. aeruginosa cells expressing the GTPase mutant GFP-PhuZΦKZD204A at the indicated arabinose concentrations.
C) Graph showing the percentage of cells containing either wild-type or mutant PhuZΦKZ (D201A or D204A) filaments when fusion proteins are expressed at increasing levels of arabinose ranging from 0% to 1%. The graph below replots the same data showing the range of arabinose concentration from 0% to 0.2%. Data represented as mean values were collected from the induced cells at indicated arabinose concentration from at least 3 different fields with at least 200 cells per field.
D) Fluorescence images of cells expressing wild-type GFP-PhuZΦPA3 at the indicated arabinose concentrations.
E) P. aeruginosa cells expressing the GTPase mutant GFP-PhuZΦPA3D190A at the indicated arabinose concentrations.
F) Graph showing the percentage of cells containing either wild-type or mutant PhuZΦPA3 (D187A or D190A) filaments when fusion proteins are expressed at increasing levels of arabinose ranging from 0% to 1%. The graph below replots the same data showing the range of arabinose concentration from 0% to 0.2%. Data represented as mean values were collected from the induced cells at indicated arabinose concentration from at least 3 different fields with at least 200 cells per field.

