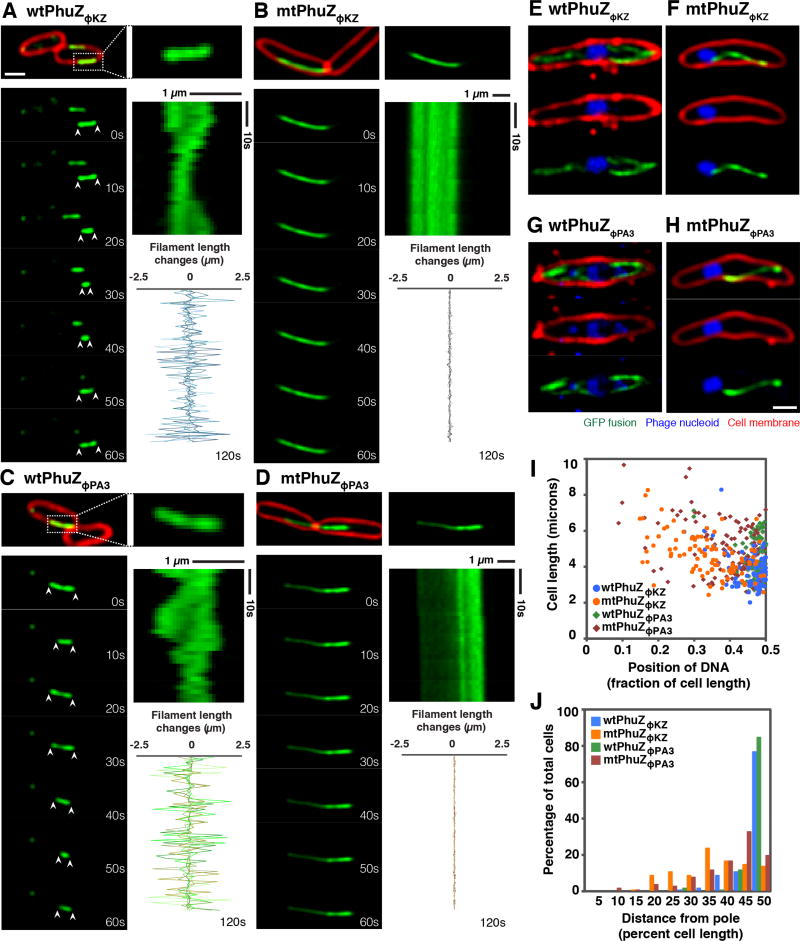
Figure 3. PhuZΦKZ and PhuZΦPA3 show dynamic instability and center the phage nucleus in the cell, while the GTPase mutants fail to position the nucleus at midcell.
Cells were grown on agarose pads and the fusion proteins were induced with 0.05% arabinose (below the critical threshold for filament assembly) for infected cells and with 0.1% arabinose (to study the dynamic instability of filaments) for uninfected cells. Cell membranes were stained red by FM4-64 and phage DNA was stained blue by DAPI. All scale bars equal 1 micron. See also Figures S3 and S4.
(A and C) Fluorescence micrographs of uninfected P. aeruginosa cells induced at 0.1% arabinose to express wild-type GFP-PhuZΦKZ (A) and wild-type GFP-PhuZΦPA3 (C). The filament in the dashed box is magnified and shown on the right. Time-lapse imaging and kymograph for one representative filament for each protein (GFP-PhuZΦKZ (A) and GFP-PhuZΦPA3 (C)) and a graph showing length changes for five representative filaments for each protein show that these filaments display dynamic instability.
(B and D) Fluorescence micrographs of uninfected P. aeruginosa cells induced at 0.1% arabinose to express mutant GFP-PhuZΦKZ (B) and mutant GFP-PhuZΦPA3 (D). Time-lapse imaging and kymograph for one representative filament. The graph shows length changes of five representative mutant filaments.
(E and G) Fluorescence micrographs of ΦKZ-infected (E) and ΦPA3-infected (G) P. aeruginosa cells induced at 0.05% arabinose to express wild-type GFP-PhuZΦKZ (E) or wild-type GFP-PhuZΦPA3 (G). The dynamic GFP-PhuZ spindle (green) and phage nucleus (blue) was centered in the infected cell at 60 mpi.
(F and H) Fluorescence micrographs of ΦKZ-infected (F) and ΦPA3-infected (H) P. aeruginosa cells induced at 0.05% arabinose to express mutant GFP-PhuZΦKZ (F) and mutant GFP-PhuZΦPA3 (H). The mutant PhuZ proteins (green) assembled a single static filament instead of a bipolar spindle resulting in mispositioning of the phage nucleus (blue) at 60 mpi.
(I) Graph showing the position of the phage nucleus in P. aeruginosa cells, expressed as a fraction of cell length. Cells expressed either wild-type GFP-PhuZΦKZ (blue circle), wild-type GFP-PhuZΦPA3 (green diamond), GTPase mutant GFP-PhuZΦKZ (orange circle) and GTPase mutant GFP-PhuZΦPA3 (red diamond). One hundred cells were counted for each group.
(J) Histogram showing position of the phage nucleus in which the data from Figure I is replotted as percentage of total cells. Cells expressed either wild-type GFP-PhuZΦKZ (blue), wild-type GFP-PhuZΦPA3 (green), GTPase mutant GFP-PhuZΦKZ (orange) and GTPase mutant GFP-PhuZΦPA3 (red). One hundred cells were counted for each group.

