
Figure 3. Aneuploidy score negatively correlates with immune infiltrate, which contributes to decreased expression of immune genes.
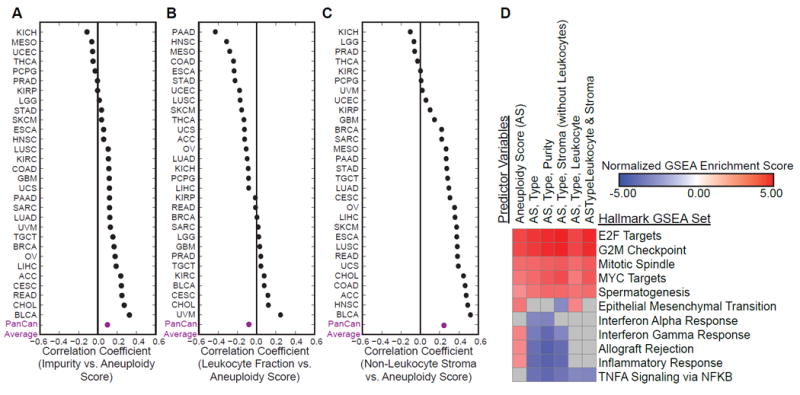
(A) Spearman correlation coefficients for aneuploidy score and impurity across TCGA tumor types, arranged from smallest to largest value. Average of correlation coefficients across tumor types is in purple.
(B) Spearman correlation coefficients for aneuploidy score and leukocyte fraction across TCGA tumor types, arranged from smallest to largest value. Average of correlation coefficients across tumor types is in purple.
(C) Spearman correlation coefficients for aneuploidy score and non-leukocyte stroma across TCGA tumor types, arranged from smallest to largest value. Average of correlation coefficients across tumor types is in purple.
(D) Heatmap of normalized enrichment scores for Hallmark gene sets in GSEA (Gene Set Enrichment Analysis), with FWER (family-wise error rate) p value < 0.01. Gray = not significant or not enriched. Predictor variables describe variables included in linear regression model for gene expression. Pathways are those identified from genes with significant coefficients in linear regression analysis.
See also Figure S2 and Tables S4, S5, and S6.