
Figure 6. Chromosome 3p lung cells initially have slower proliferation, but normalize over time.
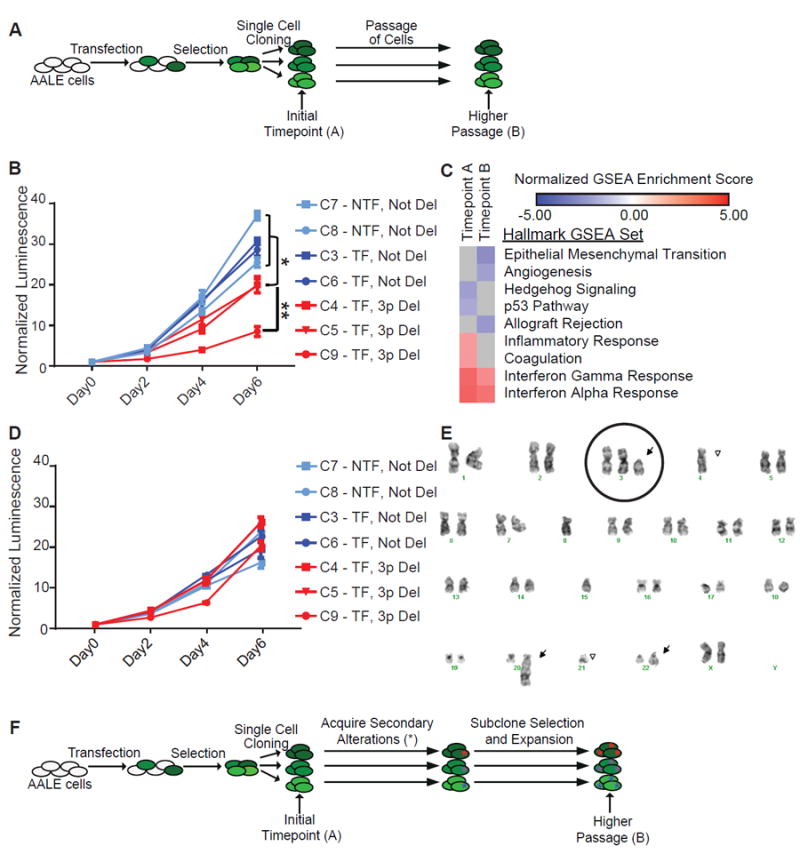
(A) AALE cells were transfected, and one day later cells were selected with puromycin for cells that had incorporated transfected DNA. Cells were single cell cloned to isolate chr_3p deleted clones, and assayed before and after extensive passaging.
(B) Proliferation curves were generated using CellTiter-Glo over 6 days (x-axis). Y-axis is relative luminescence units, normalized to Day 0. Data plotted are means with error bars +/- standard deviation. (* = p value < 0.01, ** = p value < 0.001) Cells were from Timepoint A.
(C) Heatmap of normalized enrichment scores for Hallmark gene sets in GSEA.
(D) Proliferation curves were generated using CellTiter-Glo over 6 days (x-axis). Y-axis is relative luminescence units, normalized to Day 0. Data plotted are means with error bars +/- standard deviation. Cells were from the higher passage population.
(E) Karyotype from one of the chromosome 3p deleted clones. Chromosome 3 is circled, and arrows point to chromosomal abnormalities.
(F) During passaging, cells have gained additional changes (*) to adapt to chr_3p deletion.
See also Figure S4.