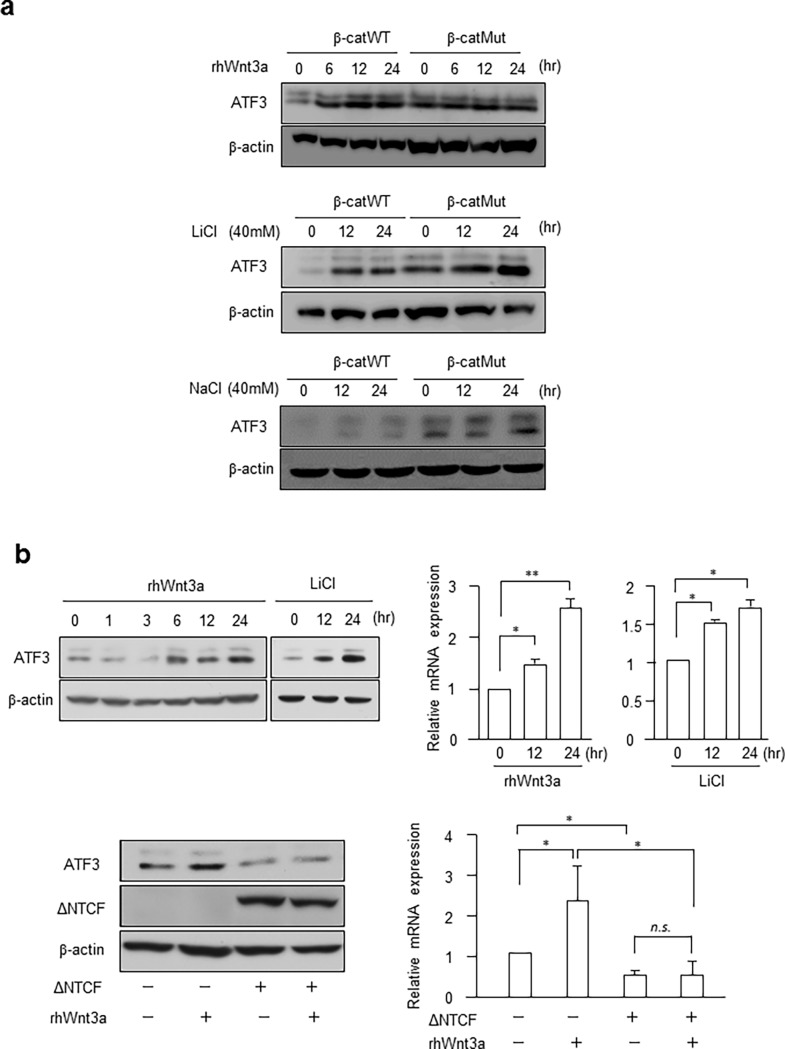
Fig 2. ATF3 expression is increased by Wnt and LiCl treatment in HCT116 and HEK293T cells.
(a) Chan’s HCT116 β-catWT or β-catMut cells were treated with 100 ng/mL rhWnt3a, 40 mM LiCl or 40 mM NaCl and assayed for the ATF3 protein. Full-length blot images are shown in Fig c in S1 File. (b) HEK293T cells were treated as in (a) and assayed for ATF3 protein and mRNA. In the lower panel, cells were transfected with ΔNTCF4, treated by rhWnt3a, and assayed. Full-length blot images are shown in Fig d in S1 File. ATF3 mRNA levels were measured and normalized to those of GAPDH mRNA; the expression was shown relative to that of control cells without rhWnt3a or LiCl treatment (upper panel), or without rhWnt3a and ΔNTCF4 transfection (lower panel). Data are represented as the mean ± S.E. values of three independent experiments. *, p < 0.05; and **, p < 0.01.

