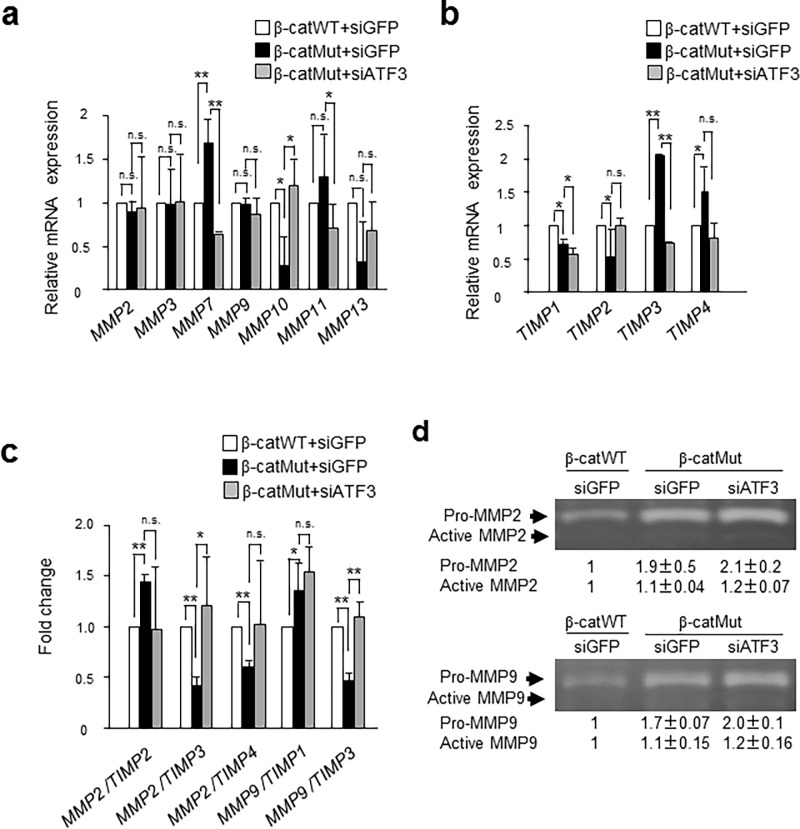
Fig 5. ATF3 regulates MMPs, TIMPs and MMP/TIMP mRNA expression but not MMP2 and MMP9 protein levels in HCT116 cells.
The mRNA expression level was measured, normalized to that of GAPDH mRNA, and compared with those of HCT116 β-catWT (open bar) and β-catMut (closed bar) or β-catMut cells exhibiting ATF3 silencing (gray bar) for MMPs (a), TIMPs (b), and MMP/TIMP ratio (c), respectively. Data are shown as relative expression (a, b) or fold change (c) compared to β-catWT cells. Data are represented as the mean ± S.E. values of three independent experiments. *, p<0.05 and **, p<0.01. In (d), the MMP2 (upper panel) and MMP9 proteins (lower panel) of the β-catWT and β-catMut cells, or β-catMut cells with silenced ATF3 gene were stained for determining the pro and active forms by gelatin zymography, as described in the Methods section. The relative amount of each form to that of β-catWT cells was measured from the density of each band obtained by ImageJ software. Full-length gel images are shown in Fig g in S1 File. Data are represented as the mean ± S.E. values of three independent experiments.

