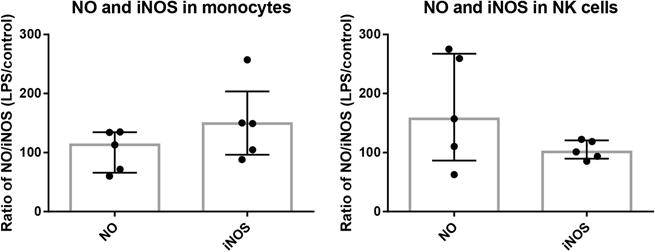
Fig. 3.

Observed percent of NO (DAF-2) positive cells and iNOS positive cells in monocytes and NK cells with and without LPS stimulation. No significant difference was observed between control and LPS stimulation in monocytes and NK cells. Bar graphs represent the median % and interquartile range of NO (DAF-2) positive and iNOS positive cells.
