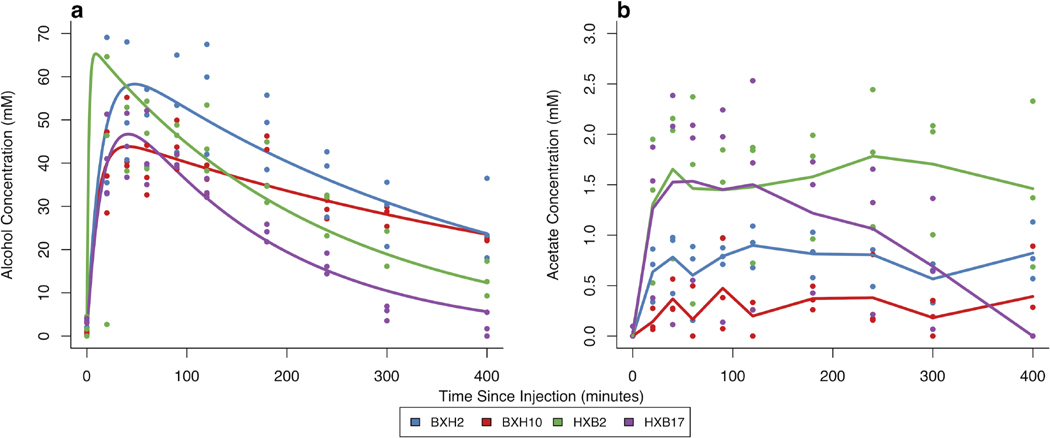
Figure 1. Representative alcohol and acetate profiles in blood after 2 g/kg alcohol administration.
Concentrations in millimolar for individual animals are represented by circles at each time point for (a) blood alcohol concentrations and (b) blood acetate concentrations. The lines represent strain-specific one-compartment pharmacokinetic models with first-order absorption and elimination (a) generated from the mean of the parameter estimates from the individual rats and the lines connecting the strain mean concentrations of acetate at each time point (b).

