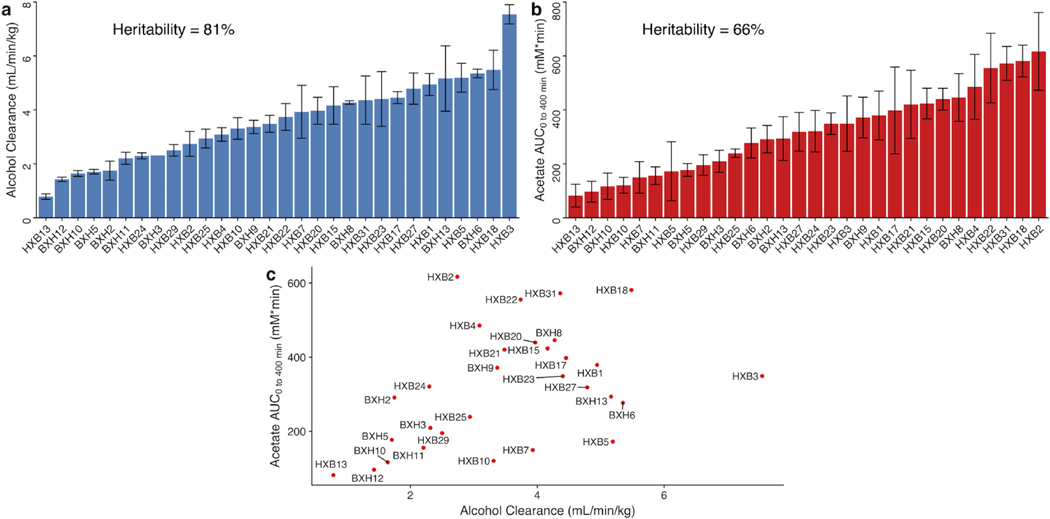
Figure 2. Distribution of alcohol clearance and acetate AUC across the HXB/BXH recombinant inbred rat panel.
The bars represent mean values of the biological replicates within the strain denoted on the x-axis for (a) first-order alcohol clearance (blue) and (b) acetate AUC (red). The error bars represent plus/minus standard error of the mean. If error bars are missing, only one biological replicate was available for the given strain. Alcohol clearance estimate and acetate AUCs were determined in each rat separately. The broad sense heritability of each phenotype was estimated as the R-squared value from a one-way ANOVA using strain as the predictor. Mean values for the two phenotypes were plotted against each other by strain to examine the (c) association between alcohol clearance and acetate AUC. Each point is labeled by its respective strain.

