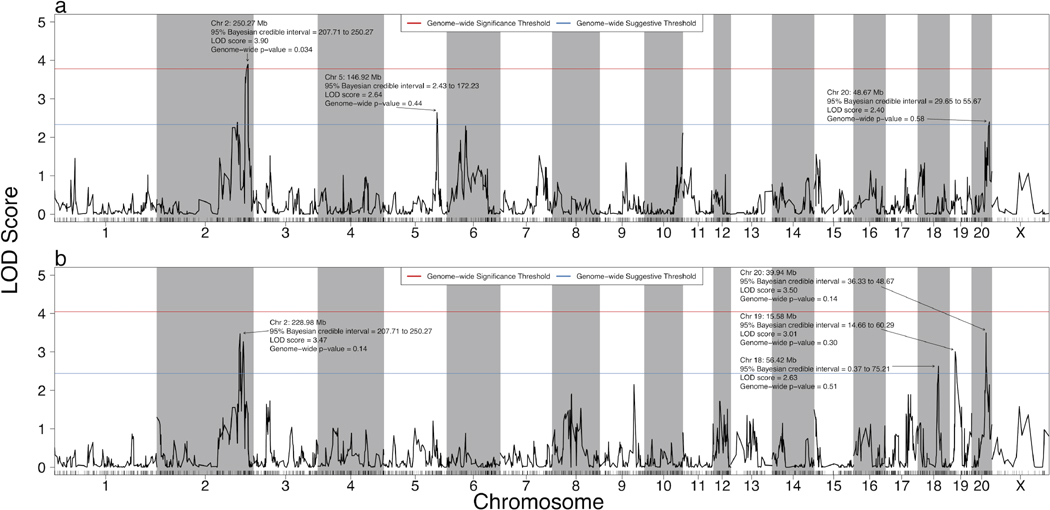
Figure 3. Quantitative trait loci for alcohol clearance and acetate AUC in the HXB/BXH recombinant inbred panel.
Strain means were used in a marker regression to determine phenotypic QTL for (a) alcohol clearance and (b) acetate AUC. The red lines represent the logarithm of odds (LOD) score threshold for a significant QTL (genome-wide p-value = 0.05), and the blue lines represent the LOD threshold for a suggestive QTL (genome-wide p-value = 0.63). Significant and suggestive QTL are labeled with their location, 95% Bayesian credible interval, LOD score, and genome-wide p-value.

