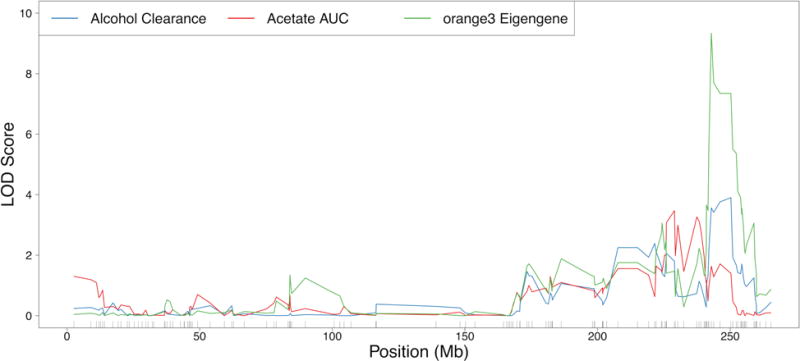
Figure 4. Chromosome 2 QTLs for alcohol clearance, acetate AUC, and the orange3 module eigengene.

Strain means were used in a marker regression to determine phenotypic QTLs (pQTLs) for alcohol clearance (blue) and acetate AUC (red), and the orange3 module eigengenes were used in marker regression to elucidate module eigengene QTLs (meQTLs, shown in green). The maximum meQTL for the orange3 module was significant (genome-wide p-value < 0.01) and overlapped a significant (genome-wide p-value < 0.05) pQTL for alcohol clearance and a suggestive (genome-wide p-value < 0.63) pQTL for acetate AUC.
