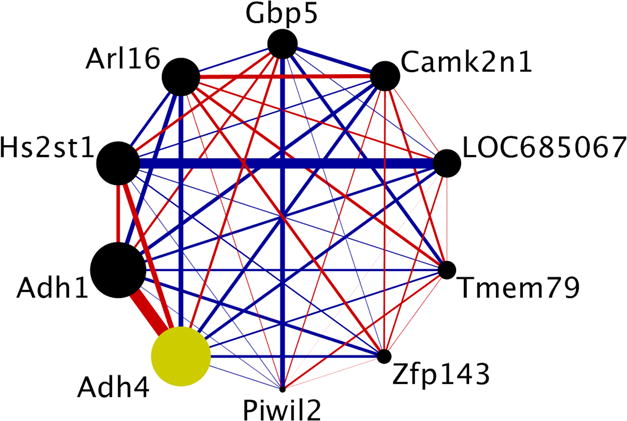
Figure 5. Connectivity within the candidate co-expression module for both alcohol clearance and acetate AUC.

Each circle represents a gene from the co-expression module. The size of each circle is weighted based on its intra-modular connectivity (not to scale), and the thickness of each edge is weighted based on the magnitude of the connectivity between the two genes (not to scale). The edge colors indicate the direction of the connectivity (red = positive, blue = negative). The hub gene, defined here as the single gene with the largest intra-modular connectivity, is colored in yellow (Adh4 = alcohol dehydrogenase 4), and its expression is positively associated with both alcohol clearance and acetate AUC. The figure was generated using Cytoscape (v. 3.4.0) (Shannon et al., 2003).
