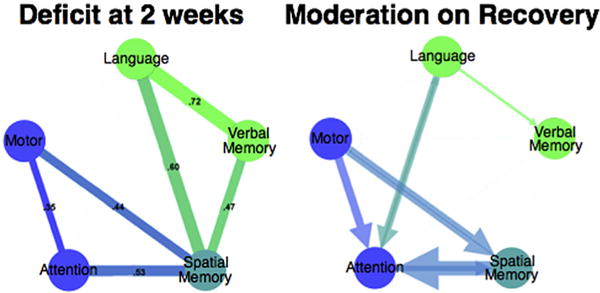
Fig. 1.

Behavioral clusters in stroke at 2 weeks (left). Thickness of line indicates strength of correlation between behavioral deficits across subjects. Moderation effect between cognitive deficits on recovery (performance change from 2 weeks to 3 months) (right). The size of the arrow is proportional to the moderation. Adapted from Ramsey et al., 2017.
