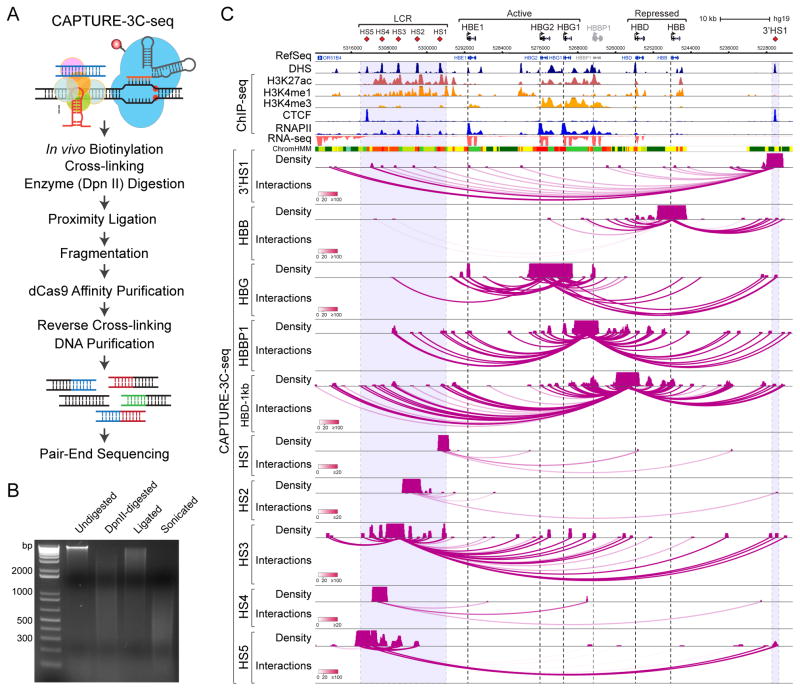
Figure 4. CAPTURE-3C-seq Analysis of Locus-specific DNA Interactions at Human β-Globin Gene Cluster.
(A) Schematic of CAPTURE-3C-seq to identify locus-specific long-range DNA interactions.
(B) Representative quality control analysis of CAPTURE-3C digestion and proximity ligation is shown.
(C) Browser view of the long-range DNA interaction profiles at β-Globin CREs (chr11:5,222,500–5,323,700; hg19) is shown. Contact profiles including the density map and interactions (or loops) are shown. The statistical significance of interactions between the captured region and other genomic regions was determined by the FDR-controlled Bayes factor (BF), and is indicated by the darkness of the interaction loops according to the color scale bars. Interactions with BF ≥ 20 were considered high-confidence long-range DNA interactions. DHS, ChIP-seq (H3K27ac, H3K4me1, H3K4me3, CTCF and RNAPII), RNA-seq, and chromatin state (ChromHMM) data are shown for comparison. Several panels of this figure were reproduced from (Liu et al., 2017) with permission from Elsevier.

