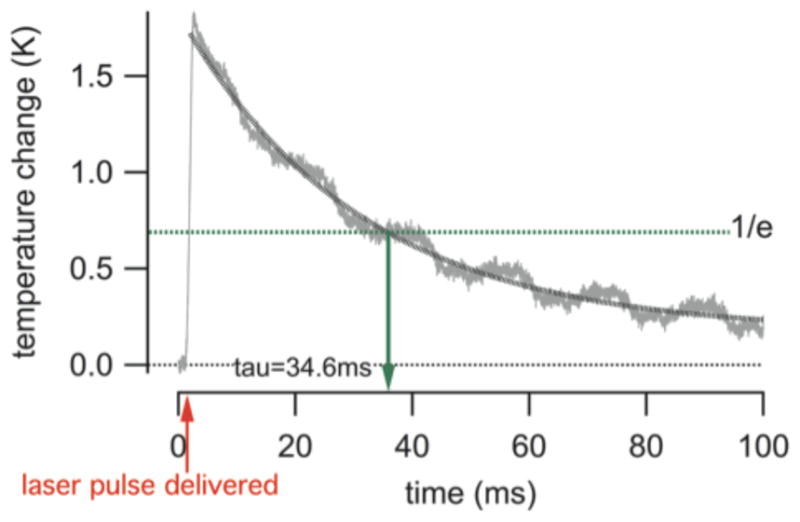
Fig. 3.

The trace shows the change in temperature during a laser pulse. The gray line shows the measured time course of the temperature and the black dotted line is an exponential fit to the data. The red arrow provides the time at which the laser pulse was delivered. The green broken line shows the 1/e decay in temperature. For the given laser parameter (λ =1860 nm, pulse length = 1 ms, pulse repetition rate = 5 Hz, and the radiant energy 1.5 mJ/pulse) and saline solution, tau (τ) was 34.6 ms. This is in good agreement with tau calculated according to [5].
