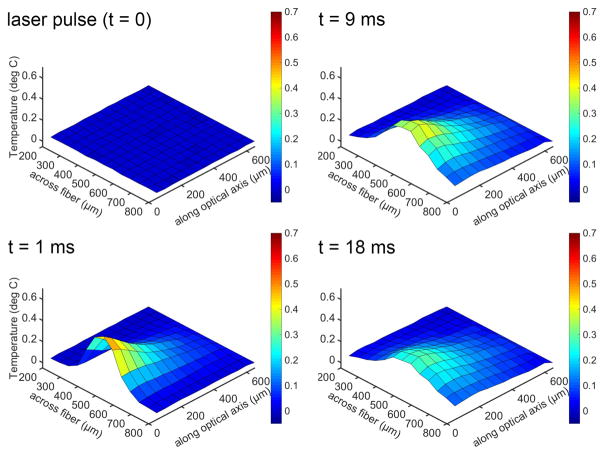
Fig. 4.
Temperature changes after the delivery of a laser pulse at different locations in front of the optical fiber. Sub-panels are taken at different time points following the laser pulse. The x-axis is the distance across the diameter of the optical fiber, with the center at 500 μm. The y-axis is the temperature change. The z-axis is the distance along the beampath, with the tip of the optical fiber at 0 μm. The heating provides a cone-like profile along the optical axis and is confined to the irradiated volume. The profile remains robust over the time course of the heating. Heat conduction in the radial and axial directions can be seen. Laser parameter for the experiments were: λ =1860 nm, pulse length = 1 ms, pulse repetition rate = 5 Hz, and the radiant energy 1.5 mJ/pulse.

