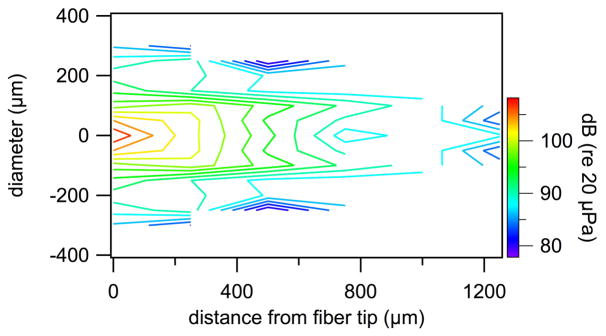
Fig. 6.
Contour plot of the pressure values measured in front of a 200 μm diameter optical fiber during laser operation (λ =1860 nm, PW=100 μs, RR=4 Hz, Q=164μJ/pulse). Significant pressure could only be measured in a confined volume in front of the fiber. Note, the pressure probe has limited sensitivity. The noise floor for the measurements is at about 80 dB (re 20μPa).

