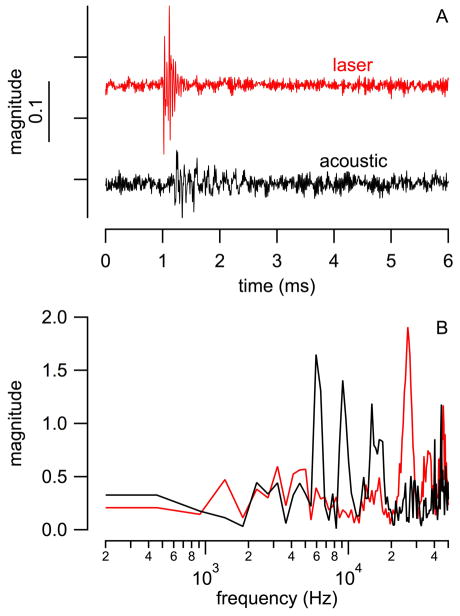
Fig. 7.
Direct comparison of pressure values of waves evoked by acoustic clicks and laser pulses in normal hearing guinea pig cochleae. (A) acoustic clicks were 50 μs with a peak level of 85 dB (re 20 μPa) and were delivered with a Beyer DT770Pro speaker to the outer ear canal. Laser pulses were delivered via a 200 μm diameter optical fiber (NA=0.22) into scala tympani. Laser parameter for the experiments were: λ =1860 nm, PW = 100 μs, RR = 4 Hz, and Q = 164μJ/pulse. (B) Traces in (A) were converted into the frequency domain using an FFT algorithm. The resulting magnitude plot shows a maximum at 48 kHz, which comes from a resonance of the pressure probe. The magnitude plot obtained from the laser trace shows a dominant maximum above 20 kHz, whereas the magnitude plot obtained from the speaker trace reveals several maxima below 20 kHz.

