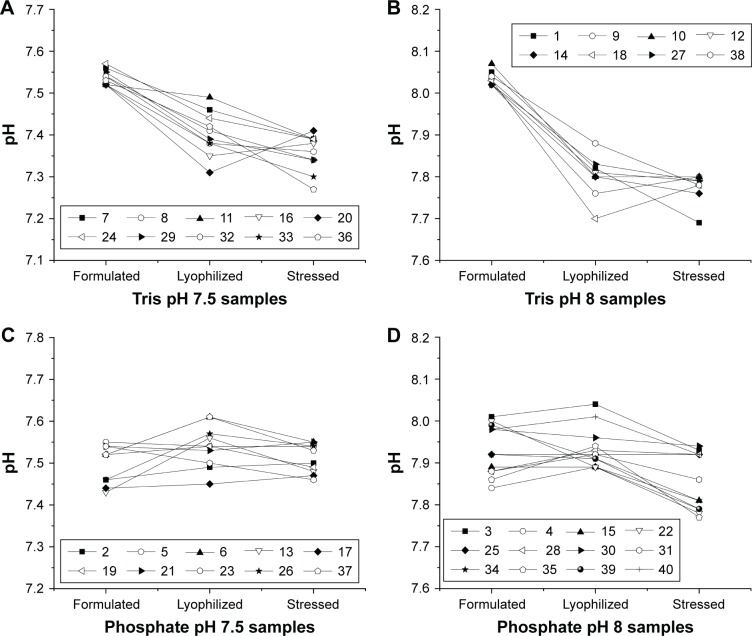
Figure 6.
pH of samples from DoE1 measured after formulation, lyophilization and reconstitution, and after heat stress. Samples are arranged by buffer type and pH including Tris pH 7.5 (A), Tris pH 8.0 (B), phosphate pH 7.5 (C), and phosphate pH 8.0 (D). The largest changes in pH are seen for Tris buffer after lyophilization, whereas smaller changes are seen for phosphate buffers (see Table S2).

