Figure 2.
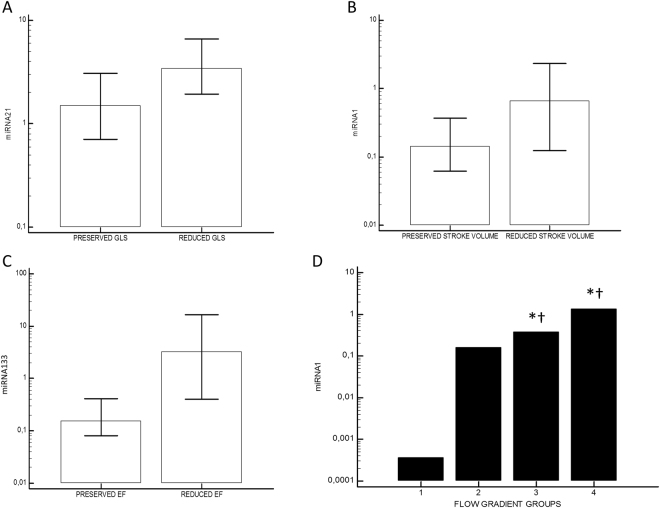
Differential distribution of miRNA expression levels. (A) miRNA21 in patients with reduced vs preserved global longitudinal strain (GLS, cut-off: −15.9%): 3.45, 1.94–6.6 vs 1.5, 0.71–3.08; p = 0.031. (B) miRNA1 in patients with reduced vs preserved stroke volume indexed (cut-off: 35 ml/min): 0.67, 0.12–2.48 vs 0.14, 0.06–0.37; p = 0.02. (C) miRNA133 in patients with reduced vs preserved ejection fraction (EF, cut-off: 50%): 7.9, 1.01–16.29 vs 1.03, 0.76–1.68; p = 0.03. (D) miRNA1 distribution according to flow-gradient classification (Group 1: Normal Flow/Low Gradient; Group 2: Normal Flow/High Gradient; Group 3: Low Flow/High Gradient; Group 4: Low Flow/Low Gradient). *p < 0.05 in comparison with group 1; †p < 0.05 in comparison with group 2.

