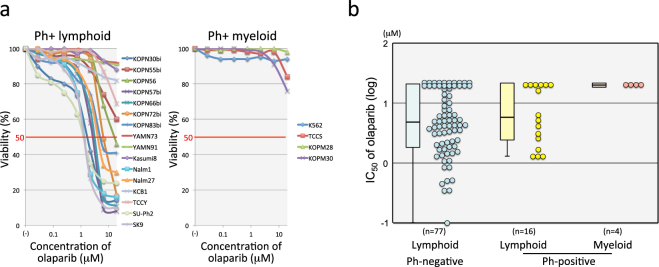
Figure 1.
Sensitivity of Ph+ leukemia cell lines to PARP1 inhibitor. (a) Dose-response curve of olaparib sensitivity in Ph+ leukemia cell lines. The vertical axis indicates the percentage (%) viability in the alamarBlue cell viability assay and the horizontal axis indicates log concentration of olaparib (μM). Left and right panels indicate the sensitivities of Ph+ lymphoid and Ph+ myeloid cell lines, respectively. (b) Olaparib sensitivity in 16 Ph+ lymphoid, 4 Ph+ myeloid, and 77 Ph-negative lymphoid leukemia cell lines. The vertical axis indicates the IC50 value of olaparib. The IC50 value of cell lines in each group is also represented by a boxplot.

