Figure 3.
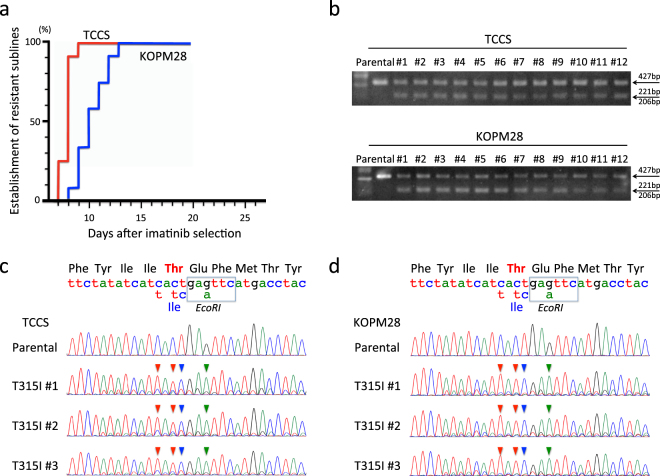
Induction of the T315I mutation in TCCS and KOPM28. (a) Efficiencies in establishment of imatinib-resistant sublines. The vertical axis indicates percentage (%) establishment of imatinib-resistant sublines, and the horizontal axis indicates days after imatinib selection. Efficiencies in SCR7-treated TCCS (red) and KOPM28 (blue) electroporated with reverse sgRNA and anti-sense ccODN are indicated. (b) Electrophoresis of PCR products after EcoRI digestion. Upper and lower panels indicate parental cells and imatinib-resistant sublines of TCCS and KOPM28, respectively. Full-length gels are presented in Supplementary Figs S2 and S3. (c,d) Sequences of PCR products. Sequences of parental cells and three imatinib-sublines of TCCS (c) and KOPM28 (d) are indicated. Wild-type genomic and amino acid sequences and mutations in template sequence for HR are indicated at the top of the panel. Arrowheads in each sequence indicate mutations as a result of HR-mediated gene editing.

