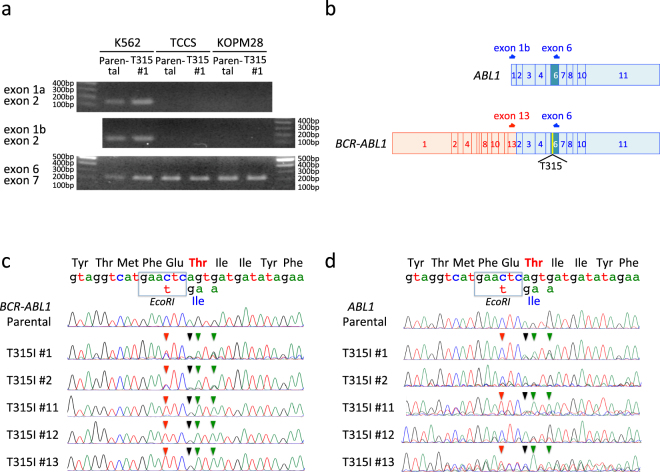
Figure 5.
Distinctive evaluation of ABL1 and BCR-ABL1 transcripts in K562. (a) RT-PCR of ABL1 and BCR-ABL1 in parental cells and imatinib-resistant subline (T315I #1) of K562, TCCS, and KOPM28. Upper, middle, and lower panel indicate RT-PCR products of exons 1a and 2, exons 1b and 2, and exons 6 and 7, respectively. Full-length gels are presented in Supplementary Figs S6 and S7. (b) Schematic of ABL1 and BCR-ABL1 transcripts. Arrows indicate primer for RT-PCR analyses. (c,d) Sequences of ABL1 (c) and BCR-ABL1 (d) transcripts in parental cells and imatinib-resistant sublines of K562. Direct sequence of RT-PCR products by the reverse primer is indicated. Wild-type mRNA and amino acid sequences in the revers direction and mutations in template for HR are indicated at the top of the panels. Arrowheads in each sequence indicate mutations as a result of HR-mediated gene editing.

