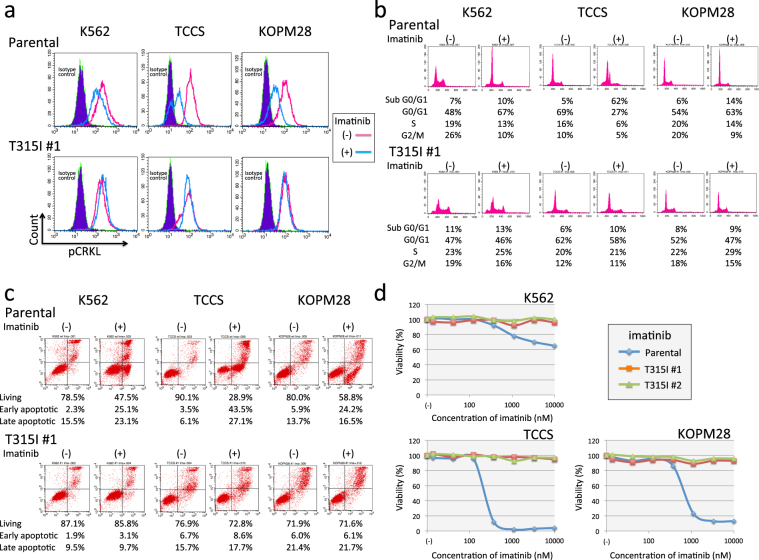
Figure 6.
Imatinib sensitivity in parental cells and T315I-acquired sublines of three cell lines. (a) Phosphorylation of CRKL in parental cells (upper panel) and T315I-acquired subline (#1) (lower panel) of K562 (left), TCCS (middle), and KOPM28 (right). Cells were cultured in the absence or presence of 1 μM for 24 hours. Blue shade, red line, and blue line indicate isotype control, phospho-CRKL of untreated cells, and phospho-CRKL of imatinib-treated cells, respectively. (b) Flow cytometric analysis of PI staining in parental cells (upper) and T315I-acquired subline (#1) (lower panel) of K562 (left), TCCS (middle), and KOPM28 (right). PI staining was performed after 24 hours culture in the absence (upper) or presence (lower) of 1 μM of imatinib. Percentages of cells in sub-G0/G1, G0/G1, S, and G2/M phases are indicated in each panel. (c) Flow cytometric analysis of apoptotic cell death in parental cells (upper) and T315I-acquired subline (#1) (lower panel) of K562 (left), TCCS (middle), and KOPM28 (right). Cells were cultured in the absence or presence of 1 μM for 24 (TCCS and KOPM28) or 60 (K562) hours, and analyzed with Annexin V-binding (horizontal axis) and 7AAD-staining (vertical axis) using flow cytometry. The percentages of living cells and early and late apoptotic cells are indicated. (d) Dose-response curve of imatinib sensitivity in parental cells (blue line) and T315I-acquired sublines (#1 and #2) (red and green lines, respectively) of K562 (upper left), TCCS (upper right), and KOPM28 (lower left). The vertical axis indicates % viability in the alamarBlue cell viability assay and the horizontal axis indicates log concentration of imatinib (nM).

