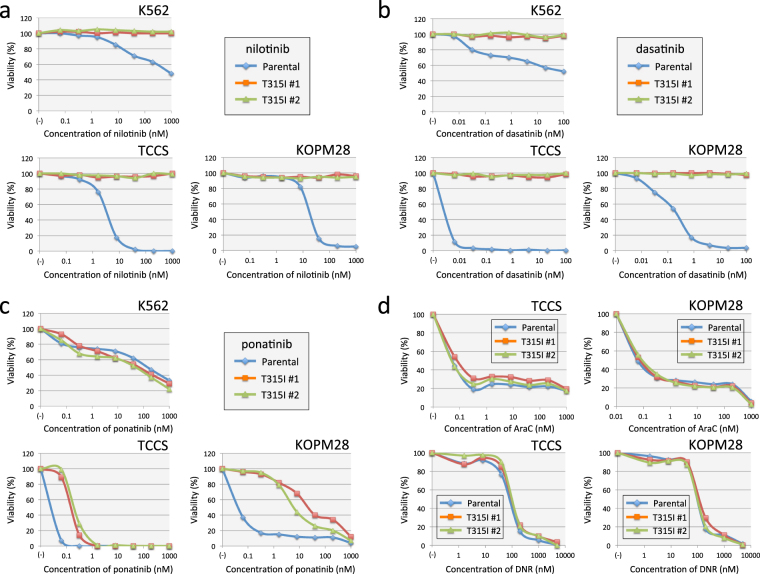
Figure 7.
TKIs and chemotherapeutic agents sensitivities in parental cells and T315I-acquired sublines of three cell lines. (a,b,c) Dose-response curves of nilotinib (a), dasatinib (b), and ponatinib (c) sensitivities in parental cells (blue line) and T315I-acquired sublines (#1 and #2) (red and green lines, respectively) of K562 (upper left), TCCS (upper right), and KOPM28 (lower left). The vertical axis indicates % viability in the alamarBlue cell viability assay and the horizontal axis indicates log concentrations of nilotinib (a), dasatinib (b), and ponatinib (c) (nM). (d) Dose-response curves of AraC (upper) and DNR (lower panel) sensitivities in parental cells (blue line) and T315I-acquired sublines (#1 and #2) (red and green lines, respectively) of TCCS (left) and KOPM28 (right panel). The vertical axis indicates % viability in the alamarBlue cell viability assay and the horizontal axis indicates log concentrations of AraC and DNR.

