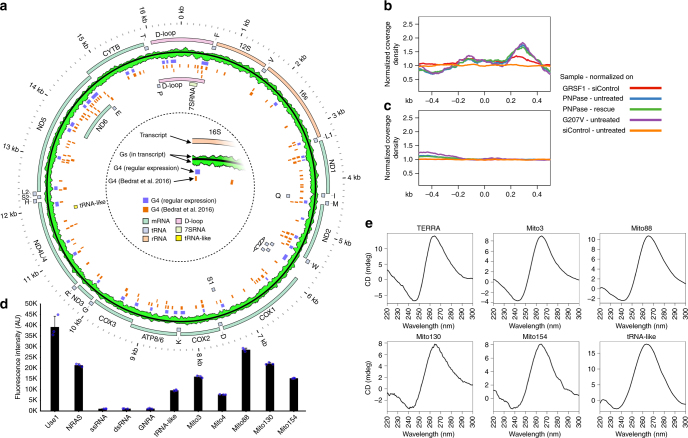
Fig. 4.
G4 RNAs, which are characteristic of L-strand transcription, are upregulated in GRSF1- or degradosome-deficient cells. a Localization of G4 sequences. G4s which we found by regular expression or were identified by Bedrat et al.11 are marked. The regular expression ([gG]{3,}/w{1,30}){3,}[gG]{3,} sought a conservative consensus (4 stretches of at least 3 Gs spaced by up to 30 nucleotides). Distribution of G nucleotides across transcripts is represented by a green track. Fractions of G nucleotides were calculated within a 50 nt window slid along the genome in 5 nt steps. Features of transcripts arising from the transcription of H-strand and L-strand of mtDNA are marked as outer and inner tracks, respectively. b, c Density coverage of RNA-seq reads around G4 sequences and their complementary sequences, respectively. The horizontal x-axis was centered with respect to the center of the G4 sequence. Data from treated cells were normalized to control samples; thus, the profiles show divergence from the control. d ThT assay of indicated oligoribonucleotides. Well-known G4-forming oligoribonucleotides (i.e., Use1, NRAS, Mito3) as well as negative controls (i.e., ssRNA, dsRNA, GNRA) were included. Bars represent average values from three independent replicates. Error bars represent standard deviation. Blue dots represent individual values. e CD (220–300 nm) spectra of indicated oligoribonucleotides. See also Supplementary Fig. 5A

