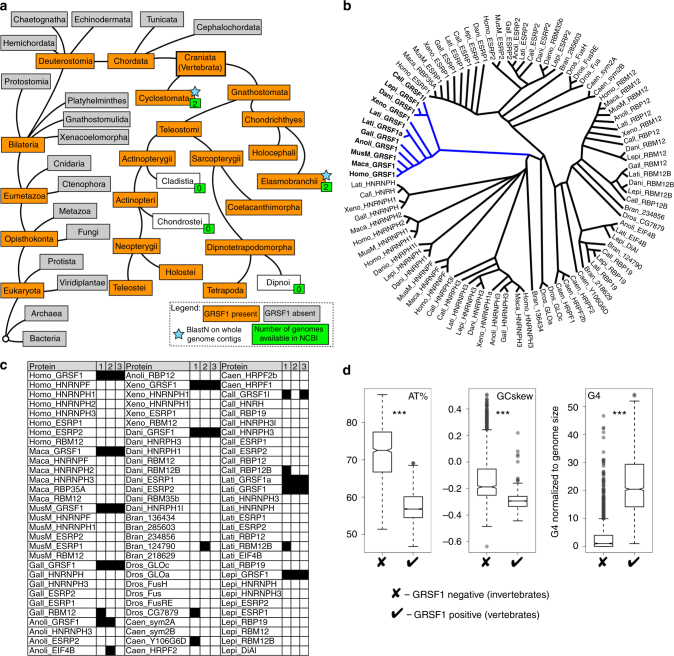
Fig. 7.
GRSF1 proteins form a distinct group of qRRM proteins that may have been acquired by mitochondria in response to changes in nucleotide composition of mitochondrial genomes. a Branching tree diagram showing organisms that do or do not possess GRSF1 (NCBI taxonomy). b Phylogenetic tree of qRRM proteins from the following organisms: Homo—Homo sapiens, Maca—Macaca mulatta, MusM—Mus musculus, Gall—Gallus gallus, Anoli—Anolis carolinensis, Xeno—Xenopus laevis, Dani—Danio rerio, Call—Callorhinchus milii, Lati—Latimeria chalumnae, Lepi—Lepisosteus oculatus, Bran—Branchiostoma floridae, Dros—Drosophila melanogaster, Caen—Caenorhabditis elegans. Multiple sequence alignments were performed using the T-coffee server. The tree was rendered using Dendroscope69. c In silico prediction of localization of qRRM proteins by three independent tools: 1. TargetP, 2. MitoProt, and 3. MultiLoc2. d Box plots representing AT content, GC skew, and number of G4 sequences identified by regular expression normalized with respect to genome size [G4 number/(length of mitochondrial genome/mean length of mitochondrial genome)]. Metazoan mitochondrial genomes (2832 vertebrates and 1100 invertebrates) were downloaded from the MetAMiGA database70. A Wilcoxon rank-sum test was used for statistical analysis of data (***P < 0.0001). The box in the boxplot represents interquartile, while upper and lower whiskers represent maximum and minimum values, respectively (excluding outliers, which are represented by semi–transparent dots). The band represents median, while the notch 95% confidence interval of the median

