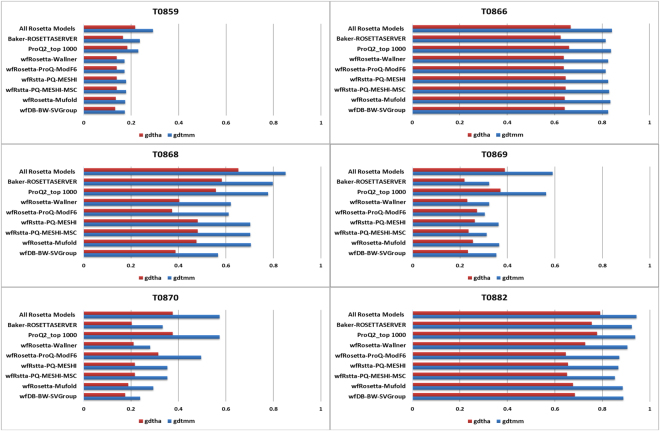
Figure 10.
Bar plots show the down-selection process across the Rosetta-based pipelines for 6 targets using GDT_HA and GDT_MM. In each row, red bars represent best GDT_HA and blue bars represent best GDT_MM. GDT_MM is a Baker-lab specific metric, where the MAMMOTH alignment algorithm (MM = MAMMOTH) is used for the superposition (slight variations with respect to GDT_TS are based on alignment). Top row shows best GDT_HA (or MM) among the hundreds of thousands of models generated by Rosetta for that target. Next row shows the best GDT_HA (MM) among the best 5 selected by the BAKER-ROSETTASERVER; next row shows the best GDT_HA (MM) among the one thousand models selected by ProQ2; the remainder rows show the best GDT_HA (MM) among the best 5 selected by the Rosetta-based WeFold groups (one set of bars each).

