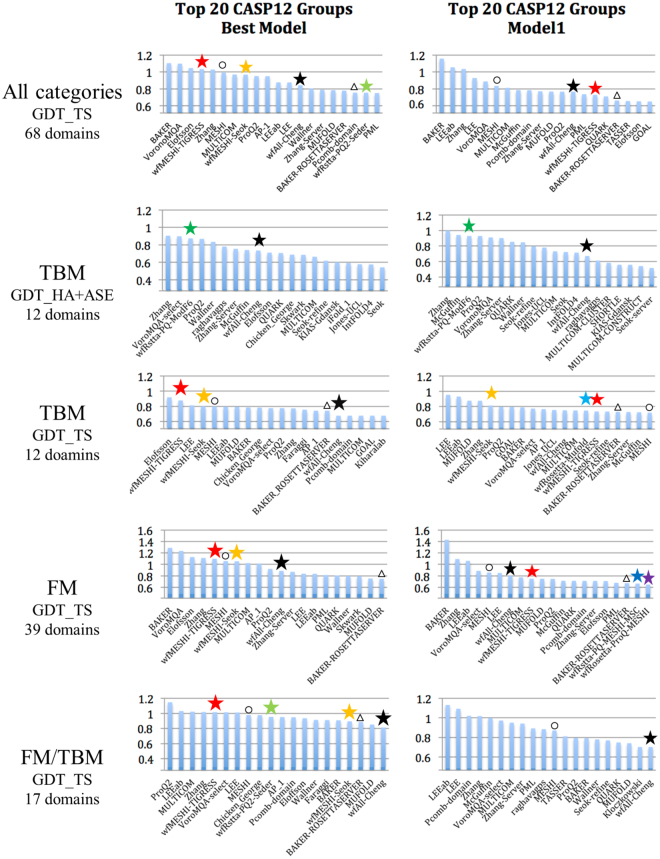
Figure 4.
Average z-scores (>−2.0) of the 20 top CASP12 groups, WeFold pipelines are marked with asterisks (Black = wfAll-Cheng; Red = wfMESHI-TIGRESS; Orange = wfMESHI-Seok; Light green = wfRstta-PQ2-seder; Dark green = wfRstta-PQ-ModF6; Light blue = wfRosetta-MUFOLD; Dark blue = wfRstta-PQ-MESHI-MSC; Purple = wfRosetta-PQ-MESHI). The results of MESHI and BAKER-ROSETTASERVER are marked by black circle and triangle respectively. Only those groups that submitted models for at least half of the targets are considered. Chart on the left shows top 20 groups/servers when considering the best model submitted by each group for each target. Chart on the right shows top 20 groups/servers when considering Model 1 only. CASP assessors used GDT_HA + ASE only for TBM targets hence the double depicting of that category. Source: http://www.predictioncenter.org/casp12/zscores_final.cgi.

