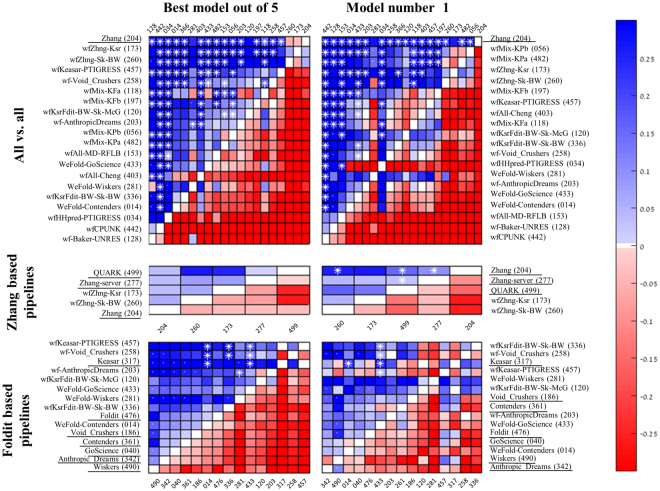
Figure 5.
Pairwise comparison of WeFold and related (underlined) CASP11 groups. Each cell represents a comparison between the row and column groups, based on the subset of targets they both predicted. Cell colors depict the difference in average z-scores (GDT_TS). Blue indicate better performance of the row group. Asterisks indicate statistical significance (p < 0.05; Wilcoxon two-sided pair test). Dots indicate that the two groups shared no more than ten targets. Rows are ordered by decreasing number of significant cells, and then by blue cells. Source: http://www.predictioncenter.org/casp12/zscores_final.cgi.

