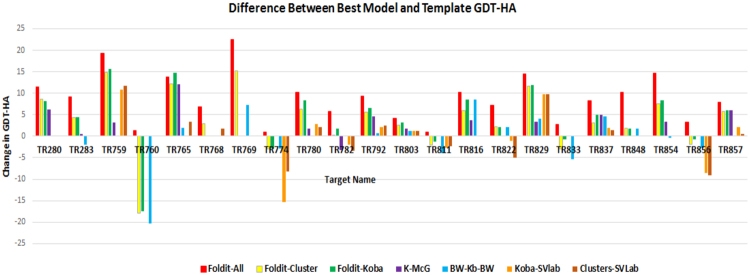
Figure 7.
Comparison of GDT_HA differences between top model in each step of the refinement pipeline and the original model provided by the CASP11 organizers for each target. The steps are identified by color bars representing the difference between the GDT_HA of the starting model and the GDT_HA of (1) the best model among those generated by Foldit players (Foldit-All), (2) the best model among the clusters (Foldit-Cluster), (3) the best model among the clusters refined by KoBaMIN (Foldit-Koba), (4) the best selection by McGuffin (K-McG), (5) the best selection by Wallner/ProQ2 (BW-Kb-BW), (6) the best selection by SVLab of KoBaMIN-refined clusters (Koba-SVlab), and (7) the best selection by SVLab based on unrefined clusters (Clusters-SVLab).

