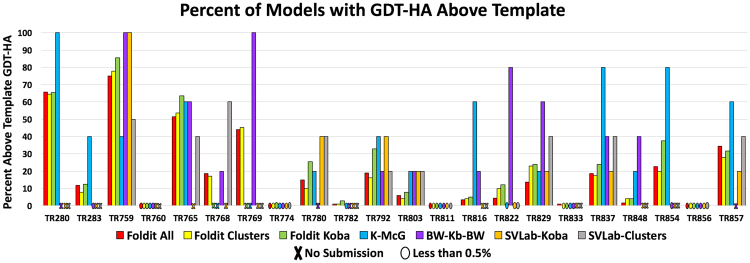
Figure 8.
Chart comparing the percentage of models in each step of the refinement pipeline that improved the GDT_HA of the original model provided by CASP organizers. The steps are identified as follows: (1) models generated by Foldit players (Foldit-All), (2) clusters (Foldit Clusters), (3) clusters refined by KoBaMIN (Foldit Koba), (4) selection by McGuffin (K-McG), (5) selection by Wallner/ProQ2 (BW-Kb-BW), (6) selection by SVLab of KoBaMIN-refined clusters (SVLab-Koba), and (7) selection by SVLab based on unrefined clusters (SVLab-Clusters).

