Figure 1.
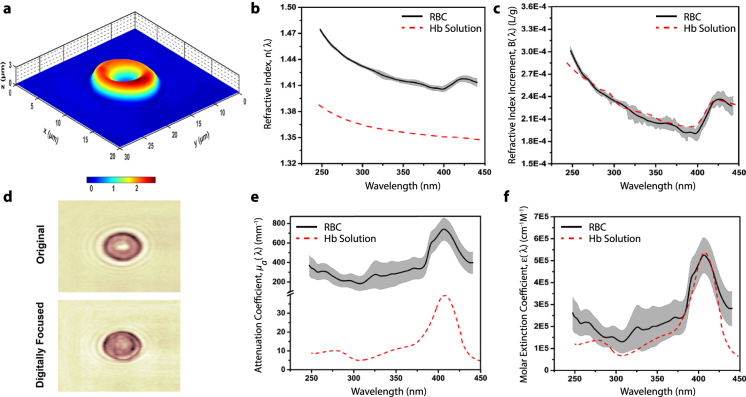
UHI microscopy of a live RBC. (a) Topological map of estimated thickness for an isolated human RBC (axes in μm). (b) Refractive index for RBC (black line) within one standard deviation range (gray area) and 2 g/dL Hb solution (dashed red line). (c) Real refractive index increment (B) spectra for the imaged RBC and Hb solution. (d) Example amplitude map of an imaged RBC before and after digital refocusing at 390 nm. Note that digital refocusing is applied to images at all wavelengths. (e) Attenuation coefficient spectra for RBC (black line) within its standard deviation range (gray area) and Hb solution (dashed red line). (f) Molar extinction coefficient spectra for the RBC and Hb solution.

