Fig. 1.
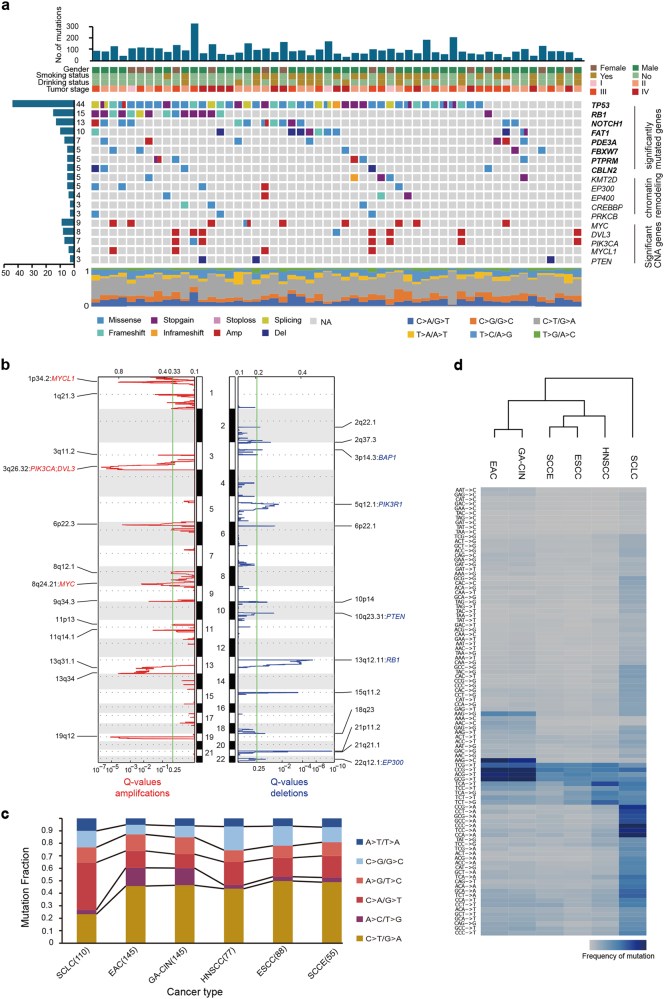
Genetic landscape of small cell carcinoma of the esophagus. a Genome-wide mutational landscape of small cell carcinoma of the esophagus, characterized by whole-exome sequencing. Top panel: The number of somatic mutations in each tumor. Four key clinicopathological characteristics are presented below. Stage was determined based on the seventh edition of the American Joint Committee on Cancer Staging Manual: Esophagus and Esophagogastric Junction. Left panel: The total number of patients harboring mutations in each gene. Middle panel: The matrix of mutations in a selection of frequently mutated genes, arranged vertically by statistical or functional group and colored by the type of alterations. Amp and Del correspond to amplification and deletion events, respectively, as indicated by a GISTIC value ± 2. Significantly mutated genes are displayed in bold. Columns represent samples. Bottom panel: Mutation fraction of the six-base substitution for each patient. b Significant copy number gains (red) and losses (blue) detected by GISTIC 2.0 (shown as peaks). Cancer-related genes with recurrent copy number alterations in peaks are labeled. c Mutation fraction of the six-base substitution labeled in different colors for small cell carcinoma of the esophagus (SCCE), esophageal squamous cell carcinoma (ESCC), head and neck squamous cell carcinoma (HNSCC), esophageal adenocarcinoma (EAC), chromosomal instability variant of gastric cancer (GA-CIN) and small cell lung cancer (SCLC). d Hierarchical clustering of SCCE, ESCC, HNSCC, EAC, GA-CIN and SCLC according to the mutation frequency of 96 mutation types (six-base substitutions each with 16 possible combinations of neighboring bases)

