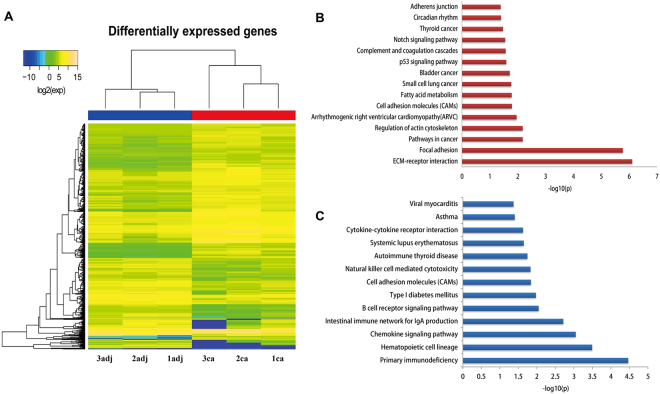
Figure 1.
Hierarchical clustering and significantly enriched KEGG pathways of differentially expressed genes. (A) Numbers, the sample number; ca, cancer tissue; adj, adjacent normal tissue; and exp, gene expression values. The expression level for each gene is represented by a colour range from blue (low) to yellow (high). (B) Significantly-enriched KEGG pathways of upregulated genes. (C) Significantly enriched KEGG pathways of downregulated genes.

