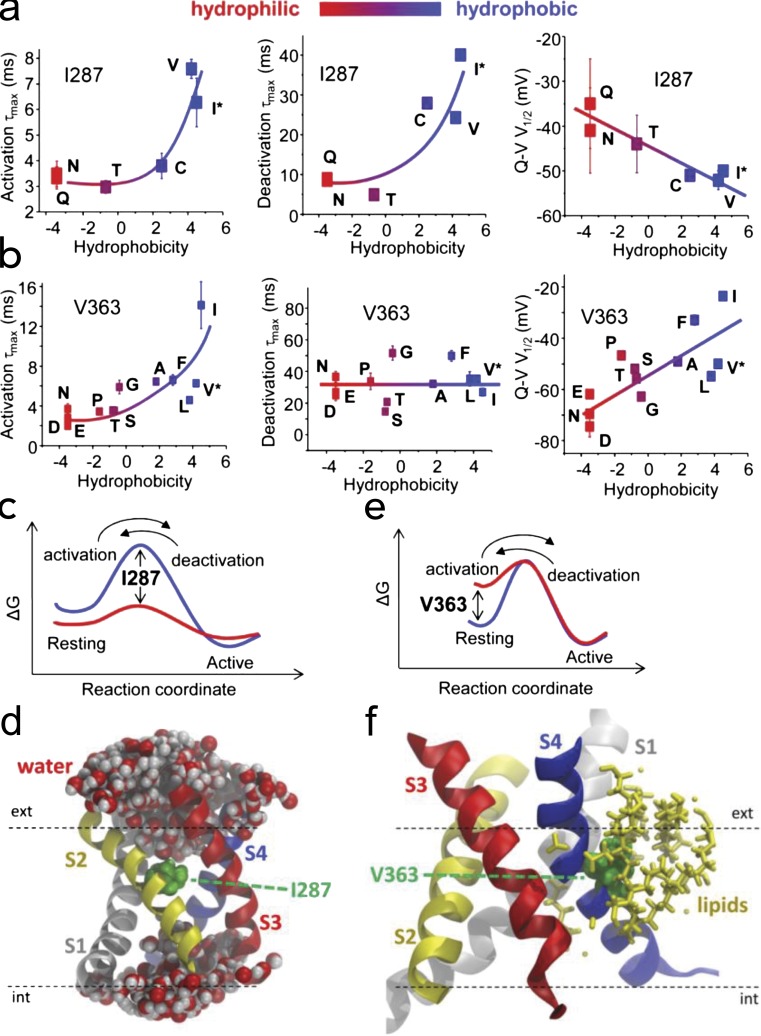
Figure 15.
Two residues that control speed of the sensor. (a) Activation, deactivation time constants and midpoint of the Q–V curve as a function of the hydrophobicity of residue 287 in Shaker. (c) Energy diagram: a replacement of the isoleucine (blue barrier) by an hydrophilic residue (red barrier) lowers the energy barrier for arginines crossing the hydrophobic plug, as indicated in d. (d) The position of the I287 in the middle of the plug. (b, e, and f) For the case of residue V363 in S4, activation and deactivation time constants and midpoint of the Q–V curve are shown as a function of hydrophobicity (b); in this case, the main effect of making the residue hydrophilic is to lift the resting well (e), which is because in the resting state, that residue faces the lipid bilayer (f). Adapted from Lacroix et al. (2013).

