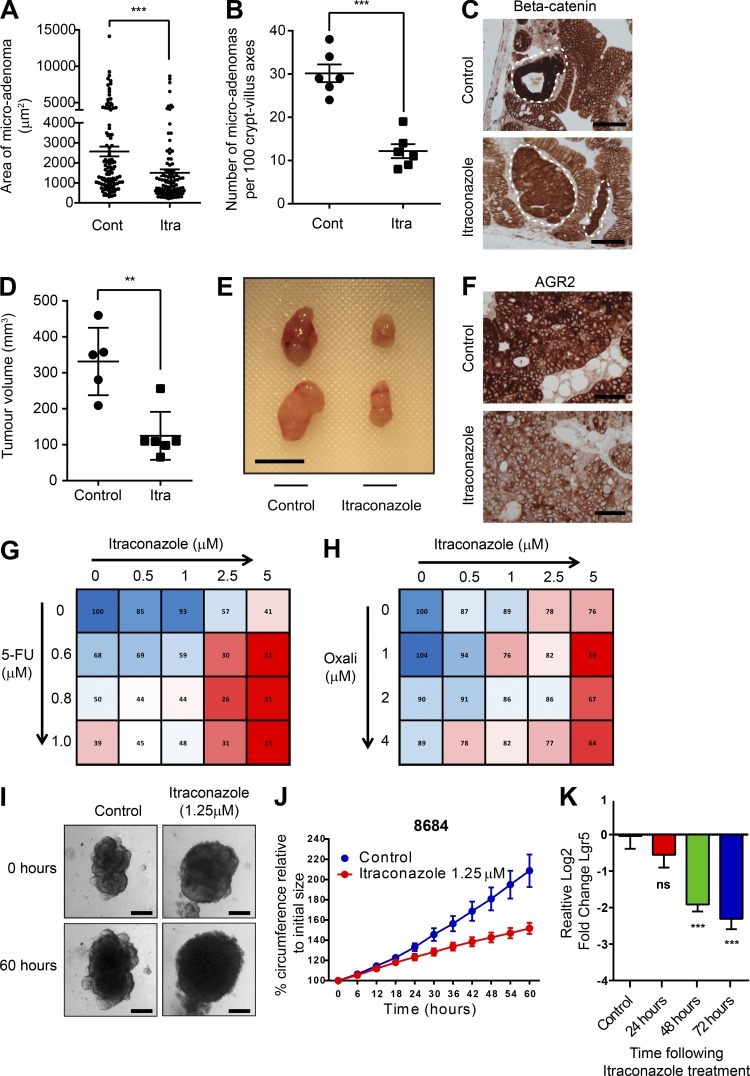
Figure 10.
Itraconazole retards Wnt activity and Lgr5 expression in preclinical assays. (A) Column scatter plot showing areas of microadenomas in the presence of itraconazole or control. (B) Column scatter plot of the numbers of microadenomas observed per 100 crypt–villus axes in itraconazole or control treated animals. n = 3; mean ± SEM; ***, P < 0.001 by unpaired t test. (C) Bright field images demonstrating less-intense nuclear β-catenin staining in microadenomas of itraconazole-dosed animals compared with controls. Bars, 100 µm. (D) Scatter plot showing the relative tumor volumes of HT55 xenografts after oral gavage of itraconazole or water to NSG mice. n = 3; mean ± SD; **, P < 0.01 by unpaired t test. Cont, control; Itra, itraconazole. (E) Representative images of treated and control xenografts. Bar, 1 cm. (F) Bright field images of anti-AGR2 immunohistochemical staining from HT55 xenografts treated with itraconazole of control. Bars, 100 µm. (G and H) Matrix plots of the synergistic effects of itraconazole on oxaliplatin- and 5-FU–treated SW948 cells. Values indicate relative cellular confluence 5 d (5-FU) and 3 d (Oxali) after treatments. n = 3. (I) Representative bright field images of organoids derived from human CRC liver metastases at initial treatment date and 60 h after treatment with itraconazole. Bars, 100 µm. (J) Growth curves of circumference changes in patient-derived liver metastasis organoids after treatment with itraconazole. (K) Histogram of RT-PCR Lgr5 expression levels in patient derived liver metastasis organoids after itraconazole treatment. n = 12; ***, P < 0.001; ns = not significant by one-way ANOVA.

