Figure 2.
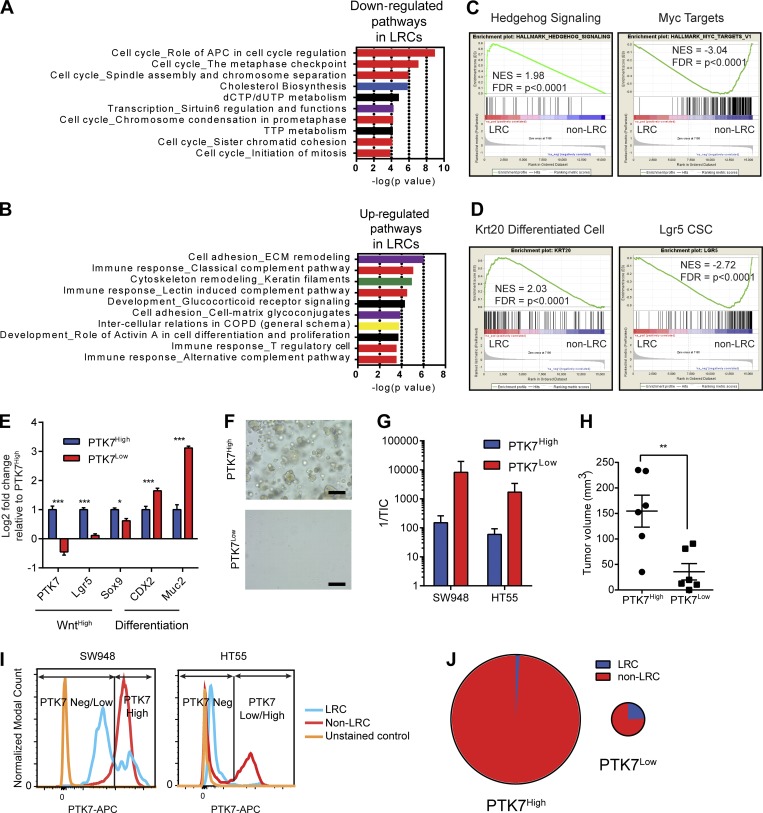
Dormant CRC cells are a differentiated cell population. (A) GO pathway analysis of genes down-regulated in LRCs. (B) GO pathway analysis of genes up-regulated in LRCs. (C) GSEA charts of significantly enriched gene sets in LRCs and non-LRCs. (D) GSEA showing enrichment of the Krt20 differentiated gene set in LRCs and the Lgr5 CSC gene set in non-LRCs. (E) RT-PCR histogram showing enrichment of Wnt targets in PTK7High and differentiation markers in PTK7Low. n = 6; mean ± SEM. ***, P < 0.001; *, P < 0.05 by two-way ANOVA. (F) Bright field images of PTK7High and PTK7Low SW948 spheroid cells 5 d after seeding in nonadherent culture. Bars, 100 µm. (G) Histogram of the tumor-initiating cell frequency (TIC) from FACS sorted SW948 and HT55 spheroids. Mean ± SEM. (H) Column scatter plot of xenograft sizes derived from PTK7High and PTK7Low SW948 cells. Mean ± SEM; **, P < 0.01 by unpaired t test. (I) FACS histogram of PTK7 levels in LRCs and non-LRCs derived from CFSE-labeled SW948 and HT55 spheroids. (J) Pie charts of the relative proportions of LRCs and non-LRCs within PTK7High and PTK7Low populations from SW948 spheroids. Size of each chart is proportional to relative numbers of cells present.

