Figure 3.
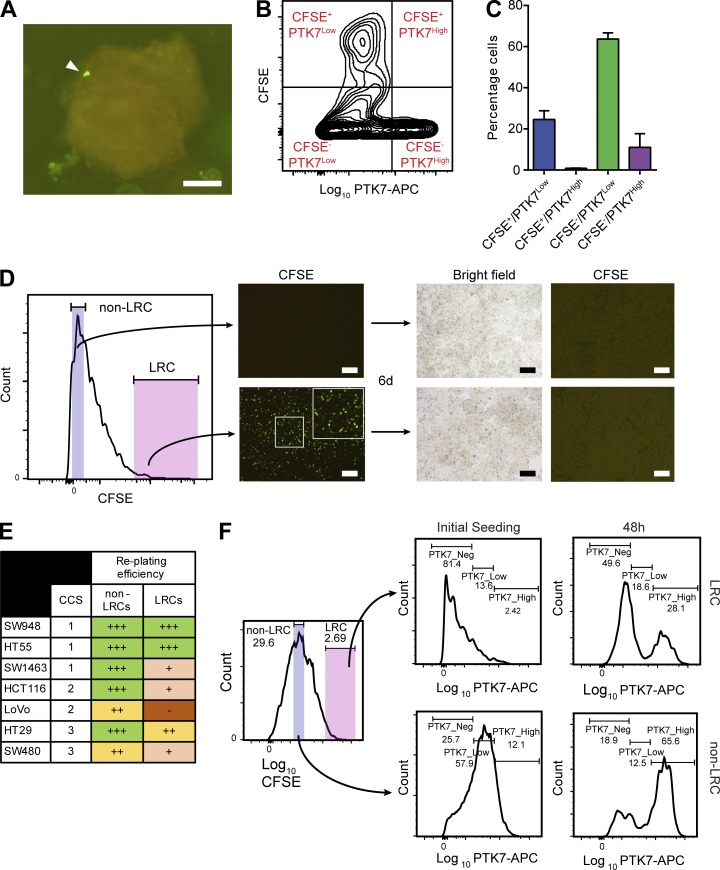
CCS1-LRCs are differentiated yet can revert to a CSC-like state. (A) Fluorescence micrograph of CFSE-labeled PDO (COLO05) 8 d after labeling with CFSE. LRC marked with arrow. (B) Representative FACS density plot of PTK7 levels in CFSE labeled PDOs. (C) Histogram of B showing the majority of LRCs (CFSE+) are differentiated (PTK7Low). (D) FACS histogram showing the sorting strategy for reseeding of SW948 CFSE-labeled spheroid-derived LRCs and non-LRCs. Accompanying fluorescent microscopy images from seeded wells. Bars, 100 µm (A and D). (E) Replating efficiencies of LRCs and non-LRCs across CCSs. (F) FACS quantification of changes in differentiation status (PTK7 levels) in SW948 spheroid LRCs and cycling cells upon replating in adherent culture.

