Figure 4.
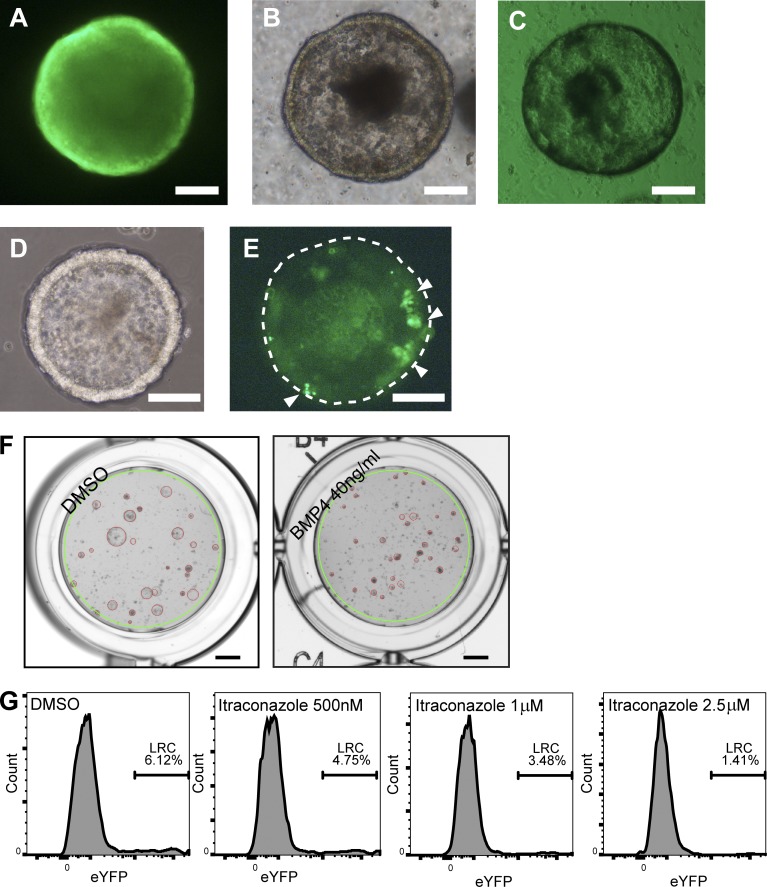
A 3D tumor organoid drug screen using label-retaining Ah-H2B-YFP_Apc1322t mice identifies modulators of spheroid growth and cellular dormancy. (A–E) Fluorescence and bright field microscopy images of βNF induced YFP-1322 organoids 24 h after βNF treatment (A and B), uninduced control (C), and 5 d after βNF treatment (D and E). White arrowheads show retained CFSE in LRCs, and the dashed line demonstrates the outer border of the organoid (E). (F) Example images of control treated organoids (left) and positive control (right) BMP4 treated and collapsed organoids. The green line indicates the uniformly applied well mask and the red circles indicate the organoids identified by a customized CHARM setting. Bars: (A–E) 100 µm; (F) 1 mm. (G) Example flow cytometry histogram plots of cellular YFP intensity (Single/PI-) from disaggregated organoids 5 d after βNF treatment and 4 d after treatment with carrier control or itraconazole at 500 nM, 1 µM, or 2.5 µM.

