Figure 5.
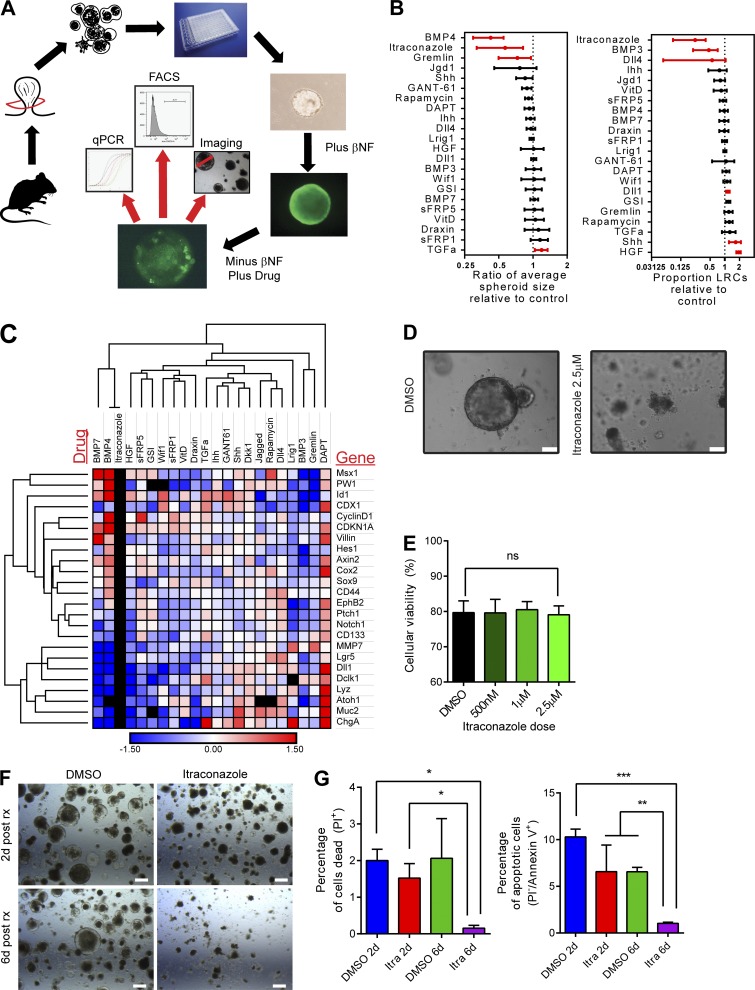
A mouse tumor organoid drug screen identifies itraconazole as a modulator of quiescence and adenoma organoid development. (A) Schematic of the drug screen protocol using YFP-1322 mice. (B) Column graphs of the effect of candidate drugs on organoid size and proportion of LRCs. Mean ± SD. Significant (P < 0.05 by independent t tests on each drug treatment compared with control) changes shown in red. (C) Hierarchical clustering of RT-PCR changes in (cancer) stem, differentiation, and pathway associated genes. Red, upregulated. Blue, down-regulated. Black, not detected. (D) Bright field images of YFP-1322 tumor organoids 10 d after single cell plating and 4 d after treatment with DMSO or itraconazole. Bars, 100 µm. (E) Percentage viability of organoid cells as determined by PI incorporation after itraconazole treatment. n = 3; mean ± SD; ns, not significant by one-way ANOVA). (F) Bright field images of Apc-deficient mouse spheroids treated with itraconazole (2.5 µM) or DMSO at early and late time points after treatment. Bars, 100 µm. (G) Histograms of changes in viability (PI) and apoptosis (Annexin V) in mouse spheroids after treatment with itraconazole at early and late time points. n = 3; mean ± SEM; *, P < 0.05; **, P < 0.01; ***, P < 0.001 by one-way ANOVA.

