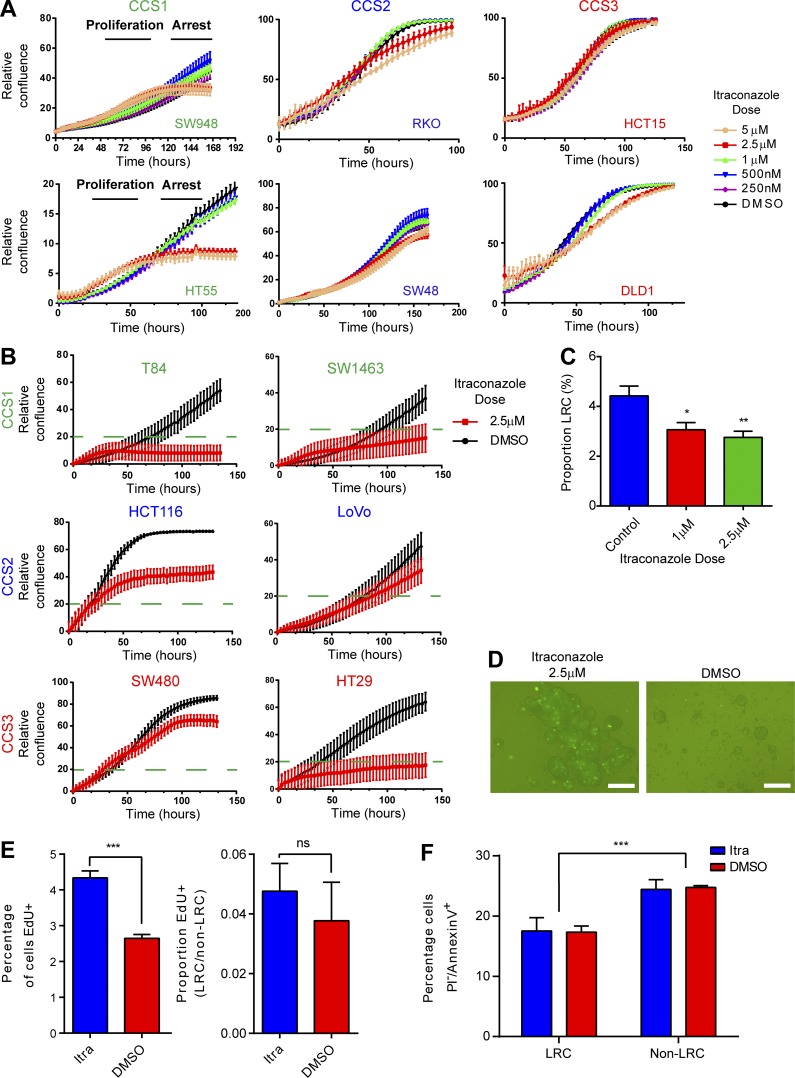
Figure 6.
Itraconazole treatment of CRC cell lines demonstrates treatment is effective in CCS1 cell lines and eliminates dormant cells. (A) Live cell confluence graphs of six CRC cell lines grown in 2D showing a dose-dependent effect in response to itraconazole in SW948 and HT55 lines. (B) Validation live cell confluence graphs for six CRC further cell lines. Full sensitivity (confluence <20%) was seen in T84 and SW1463 cells (CCS1) and HT29 cells (CCS3). (C) FACS measurements of the proportions of LRCs in CFSE labeled SW948 spheroids 4 d after treatment with itraconazole or DMSO. n = 3; mean ± SEM; *, P < 0.05 by one-way ANOVA. (D) Fluorescent images of SW948 spheroids grown in nonadherent culture after CFSE labeling for 4 d and then treated with itraconazole or DMSO for 48 h. Bars, 100 µm. (E) Histograms quantifying EdU incorporation in SW948 spheroids treated with itraconazole or DMSO during the proliferative burst. n = 3; mean ± SEM; ***, P < 0.001 by unpaired t test. (F) Histogram displaying levels of apoptosis (PI−/AnnexinV+) in HT55 CFSE labeled spheroids 10 d after labeling and 48 h after treatment with itraconazole or DMSO. n = 3; mean ± SEM; ***, P < 0.001 by two-way ANOVA; ns, not significant.

