Figure 9.
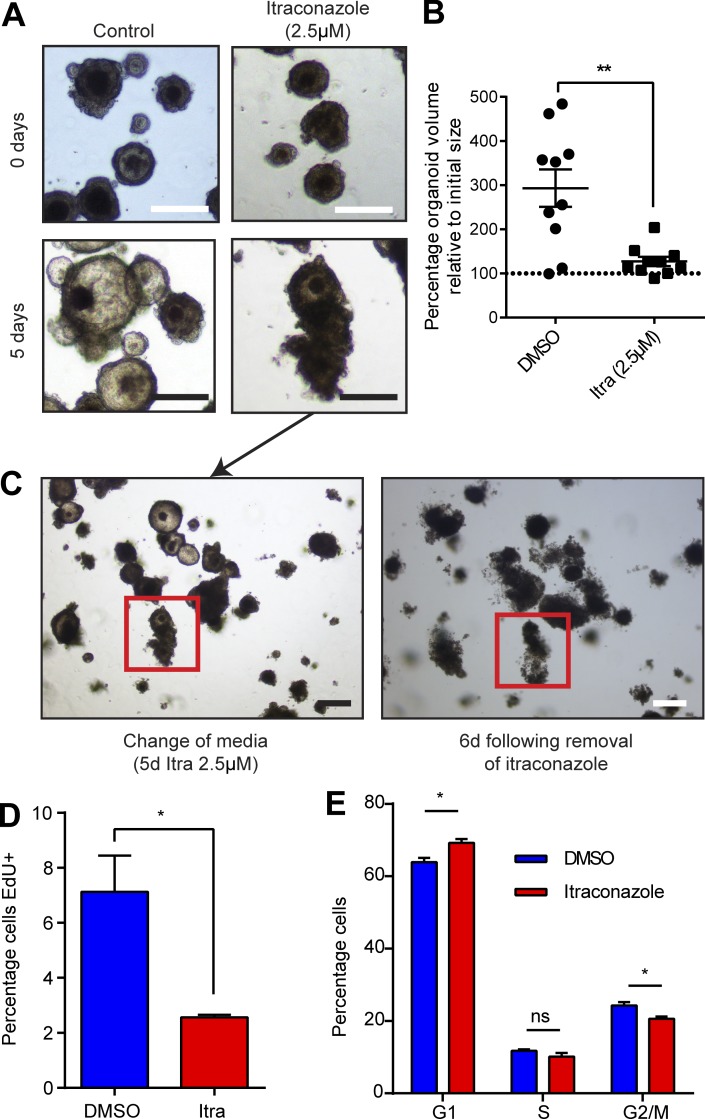
Itraconazole treatment induces phenotypically similar changes in primary PDOs to that seen in cell lines. (A) Representative bright field images of changes in PDO morphology in response to itraconazole treatment. Bars, 100 µm. (B) Dot plot quantification of the change in PDO volume in response to itraconazole treatment or DMSO. n = 3; mean ± SEM; **, P < 0.01 by two-tailed Mann-Whitney test. (C) Bright field–matched images demonstrating ongoing response to itraconazole treatment after removal of treatment. Bars, 100 µm. (D) Histogram of EdU incorporation in PDOs 5 d after itraconazole treatment or control. n = 3; mean ± SEM; *, P < 0.05 by unpaired t test. (E) Histogram showing cell cycle distribution of PDO cells after 5 d of itraconazole treatment or control. n = 3; mean ± SEM; *, P < 0.05; ns = not significant by independent t tests on each cell cycle stage).

