Figure 3.
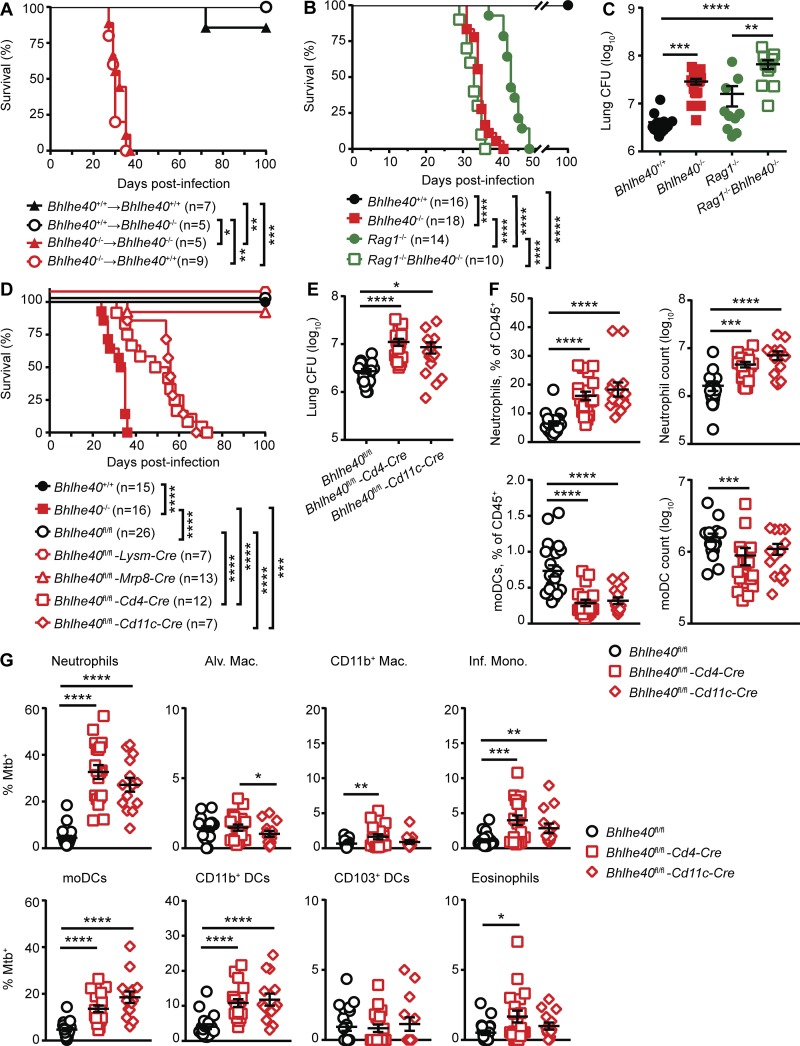
Bhlhe40 functions in both innate and adaptive immune cells to control Mtb infection. (A) Bhlhe40+/+ or Bhlhe40−/− mice were lethally irradiated, reconstituted with Bhlhe40+/+ or Bhlhe40−/− bone marrow, and monitored for survival after Mtb infection (n = 5–9 per group). (B and C) Bhlhe40+/+, Bhlhe40−/−, Rag1−/−, or Rag1−/−Bhlhe40−/− mice were infected with Mtb and monitored for survival (B; n = 10–18 per group) or lung Mtb burden at 21 dpi (C; n = 10–17 per group). (D–G) Bhlhe40+/+, Bhlhe40−/−, Bhlhe40fl/fl, Bhlhe40fl/fl-Lysm-Cre, Bhlhe40fl/fl-Mrp8-Cre, Bhlhe40fl/fl-Cd4-Cre, and Bhlhe40fl/fl-Cd11c-Cre mice were infected with Mtb and monitored for survival (D; n = 7–26 per group), lung Mtb burden at 21 dpi (E; n = 14–21 per group), lung neutrophil and moDC absolute count along with percentage of the total CD45+ population at 21 dpi (F; n = 14–21 per group), and frequency of GFP (Mtb)–positive lung cells at 21 dpi (G; n = 14–21 per group). Mac., macrophage; Inf. Mono., inflammatory monocyte; Alv. Mac., alveolar macrophage. (A, B, and D) Each point represents data from one mouse, and the mean ± SEM is shown. The number of biological replicates is indicated in parentheses. Statistical differences were determined by log-rank Mantel-Cox test. In D, Bhlhe40fl/fl-Cd4-Cre and Bhlhe40fl/fl-Cd11c-Cre mice were compared with Bhlhe40fl/fl, Bhlhe40−/−, and each other. (C, E, and G) Statistical differences were determined by one-way unpaired ANOVA with Tukey’s post test for normally distributed groups or unpaired Kruskal-Wallis test with Dunn’s multiple comparison test for nonnormally distributed groups. *, P < 0.05; **, P < 0.01; ***, P < 0.001; ****, P < 0.0001. Data are from two (A), four (B), five (C), or seven (D–G) independent experiments.

