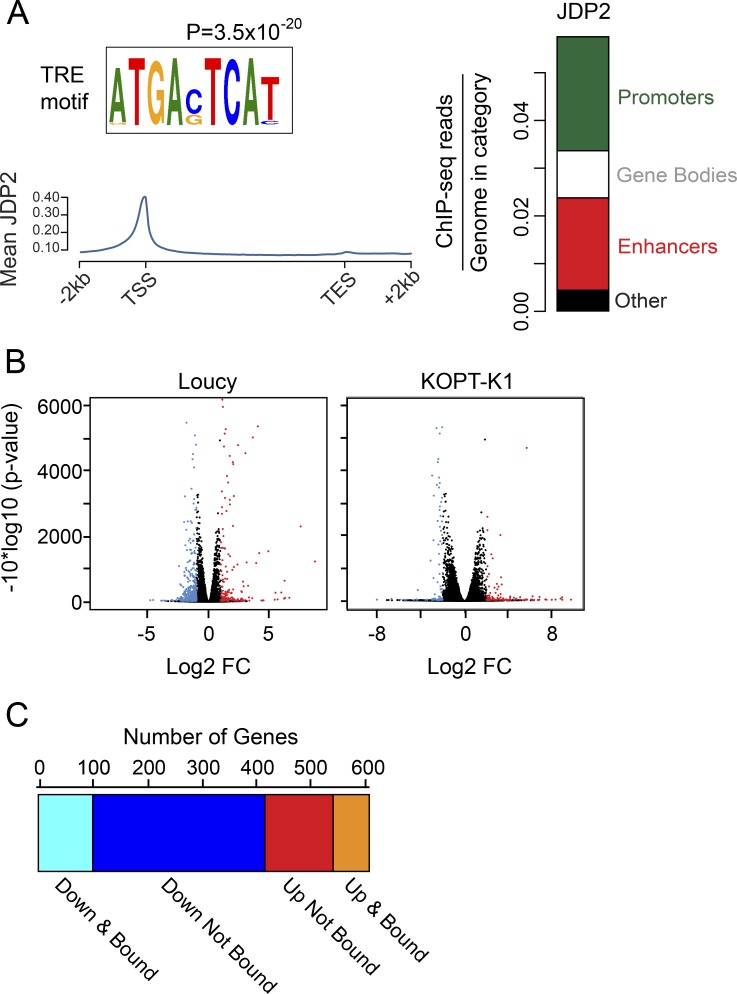
Figure 3.
JDP2 occupies both promoters and enhancers and can both activate and repress target genes. (A) The preferred binding sequence for JDP2 is the palindromic TRE motif as calculated using Analysis of Motif Enrichment from the MEME suite. The adjusted P value is shown. Mean JDP2 occupancy from the TSS to TES at gene bodies, as analyzed from genome-wide binding by ChIP-seq in Loucy cells. The y axis shows ChIP-seq read concentration normalized to number of base pairs in the given region type. Right: Relative genome-wide occupancy of JDP2 at gene promoters (green), at enhancers (red), and within the gene body (white). (B) Volcano plot showing log2 fold change (FC) in gene expression 20 h after JDP2 knockdown in Loucy (left) and KOPT-K1 (right) cells stably expressing a doxycycline-inducible JDP2 shRNA. The y axis shows adjusted P value. Genes represented in blue are significantly down-regulated, those in red are significantly up-regulated, and those in black are not differentially expressed. RNA-seq was performed in biological triplicate. (C) Graph illustrating the number of genes in Loucy cells that are differentially expressed (by RNA-seq) after JDP2 knockdown and either bound by JDP2 (by ChIP-seq; direct target genes) or not bound by JDP2 (genes regulated indirectly after JDP2 knockdown).

