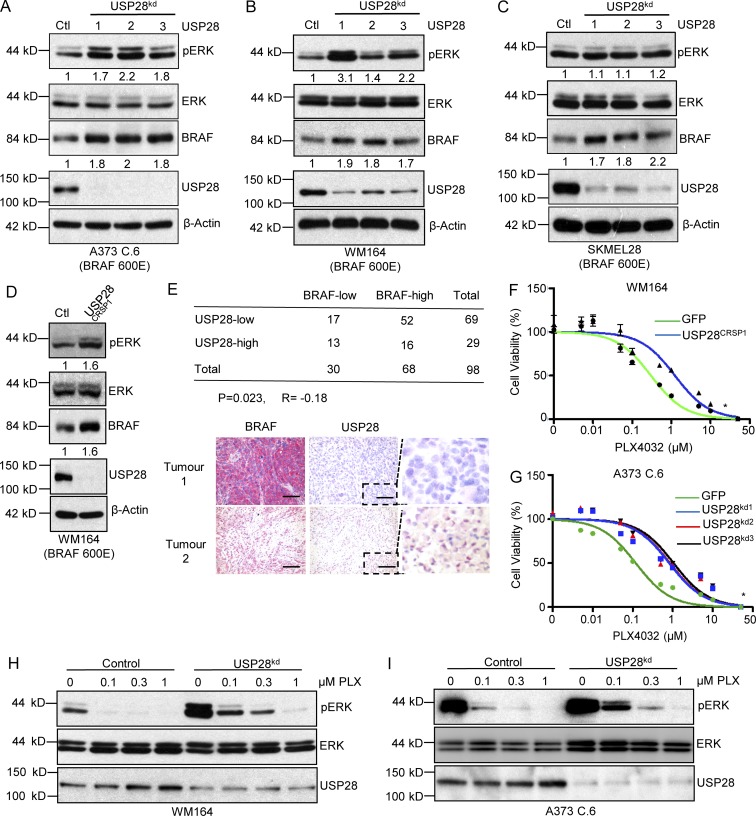
Figure 4.
Down-regulation of USP28 leads to BRAF inhibitor resistance. (A–C) Representative images of immunoblot analysis of BRAF (V600E) mutant melanoma cell lines A373C.6 (A), WM164 (B), and SK-MEL-28 (C) infected with scrambled or USP28 shRNA lentivirus. Whole cell extracts were probed with the indicated antibodies. Data shown are representative of three independent and reproducible experiments. (D) Immunoblot analysis of WM164 or WM164USP28CRSP cells. Whole cell extracts were probed with the indicated antibodies. Data shown are representative of three independent and reproducible experiments. (E) Correlation between USP28 and BRAF protein levels in melanoma patients (n = 98). Statistical significance was determined by an χ2 test (P = 0.023). R is the correlation coefficient (R=−0.18; top). Immunohistochemical staining of BRAF and USP28 on sequential sections of ME2082B (Biomax) melanoma tissue microarray. Red staining indicates positive immunoreactivity. Bars, 50 µm. Dashed boxes indicate zoomed area. (F) WM164 or WM164USP28CRSP cells treated with escalating doses of vemurafenib (PLX4032) for 72 h. Viability was assessed using CellTiter Glo as described by the manufacturer. Data represent the mean of six replicates. (G) A373C.6 cells or A373C.6 USP28 knockdown cells treated with escalating doses of vemurafenib (PLX4032) for 72 h. Viability was assessed using CellTiter Glo as described by the manufacturer. Data represent the mean of six replicates. (H) Immunoblot analysis of WM164 or WM164 USP28 knockdown cells treated with different concentrations of vemurafenib (PLX4032) for 1 h. Whole cell extracts were probed with the indicated antibodies. Data shown are representative of three independent and reproducible experiments. (I) Immunoblot analysis of A373C.6 or A373C.6 USP28 knockdown cells treated with different concentrations of vemurafenib (PLX4032) for 1 h. Whole cell extracts were probed with the indicated antibodies. Data shown are representative of three independent and reproducible experiments. For respective immunoblots proteins levels were quantified by ImageJ comparing indicated proteins to relevant controls.

