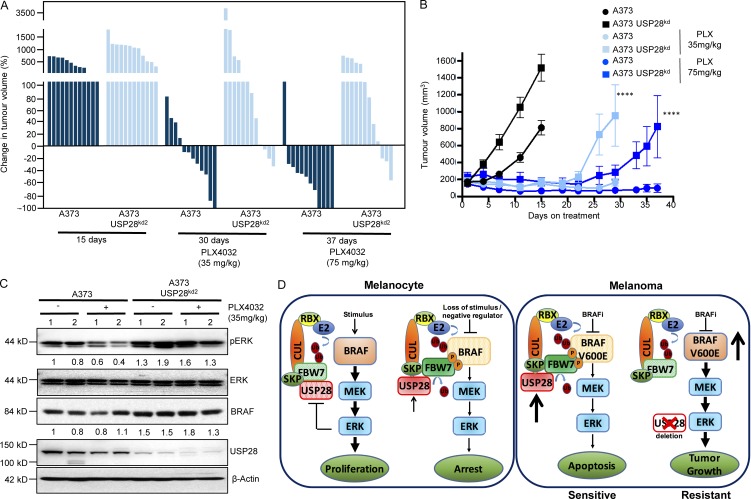
Figure 6.
Down-regulation of USP28 impairs the effects of vemurafenib in vivo. (A) Waterfall plot showing the percentage change in tumor volume for the individual tumors at day 15 for untreated controls, day 30 for mice treated twice daily with 35 mg/kg and day 37 for mice treated with 75 mg/kg (n = 12). (B) Quantification of nude mice bearing xenograft tumors of A373 C.6 or A373 C.6 USP28 knockdown cells (n = 12). Mice were treated twice daily with vemurafenib (PLX4032; 35 mg/kg, light blue) for 30 d or (75 mg/kg, dark blue) for 37 d (end of experiment). Points indicate mean tumor volume; bars, SE. A two-tailed Student’s t test compares the two treated grouped populations of control cells versus USP28-depleted cells. ****, P < 0.0001. (C) Immunoblot analysis of mouse xenograft A373 C.6 melanoma tumors stably infected with USP28 knockdown vector or relevant controls. Tumor lysates were analyzed with indicated antibodies. Data shown are representative of two independent and reproducible experiments. 1 and 2 indicate two individual mice. Respective proteins levels were quantified by ImageJ comparing indicated proteins to relevant controls. (D) Schematic of vemurafenib resistance in USP28 deleted melanoma cells.

