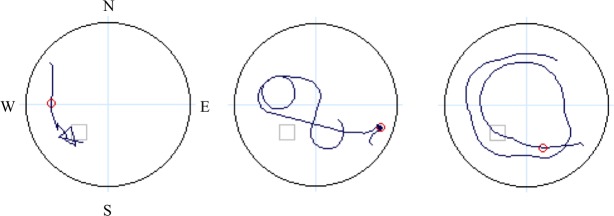
FIGURE 3.
Schematic denoting four quadrants (light blue lines: N, E, S, W), with dark blue lines representing sample paths from three study participants during navigation on the probe trial. The small gray open square is the location of the hidden platform and the small red circle is used to calculate heading error.

