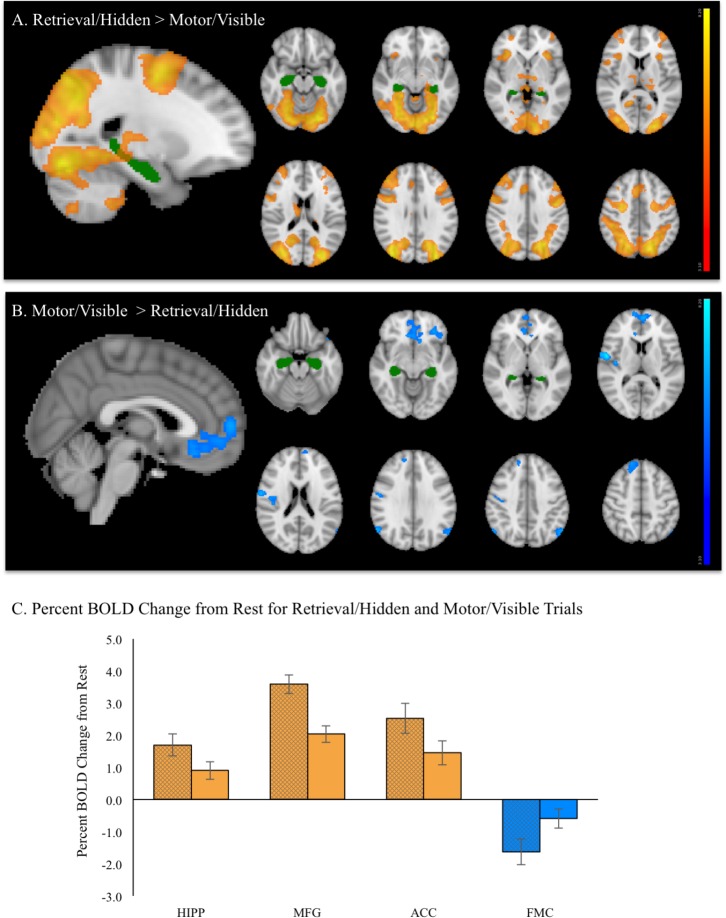
FIGURE 6.
During fMRI vMWT performance: (A) Regions showing significant increases in brain activation (red–yellow, p < 0.05 corrected) during retrieval/hidden trials (with room cues) relative to motor/visible trials (with no room cues). (B) Regions showing significantly greater activation (blue–light blue, p < 0.05 corrected) during motor/visible trials relative to retrieval (hidden platform) trials. For reference, the hippocampus region of interest from the Harvard-Oxford Subcortical Structure Atlas threshold at 30% is shown in green. (C) Mean % BOLD signal change for retrieval/hidden > rest (solid bars with black cross hatch) and motor/visible > rest (solid bars) extracted from hippocampus (HIPP), middle frontal gyrus (MFG), anterior cingulate cortex (ACC), and frontal medial cortex (FMC). Orange indicates increased BOLD signal, blue indicates decreased BOLD signal.

